How to Use Twitter Data for Crisis Sentiment Analysis
How to Use Twitter Data for Crisis Sentiment Analysis
Twitter data can help you understand public sentiment during emergencies like natural disasters or health crises. By analyzing tweets in real time, you can gauge emotions - positive, negative, or neutral - and respond faster to evolving situations. Here's a quick overview of how to get started:
- Access Twitter Data: Use tools like TwitterAPI.io to collect live or historical tweets. It supports filters like hashtags, keywords, and locations for targeted data.
- Clean the Data: Preprocess tweets by removing URLs, mentions, and duplicates while retaining useful elements like hashtags and emojis.
- Analyze Sentiment: Use pre-trained models like RoBERTa or VADER to classify tweets into sentiment categories. Assign numerical scores for deeper insights.
- Visualize Trends: Build dashboards to track sentiment changes over time and identify spikes in negativity or positivity.
- Automate Alerts: Set up workflows to notify teams in real time when sentiment shifts, enabling quicker crisis management.
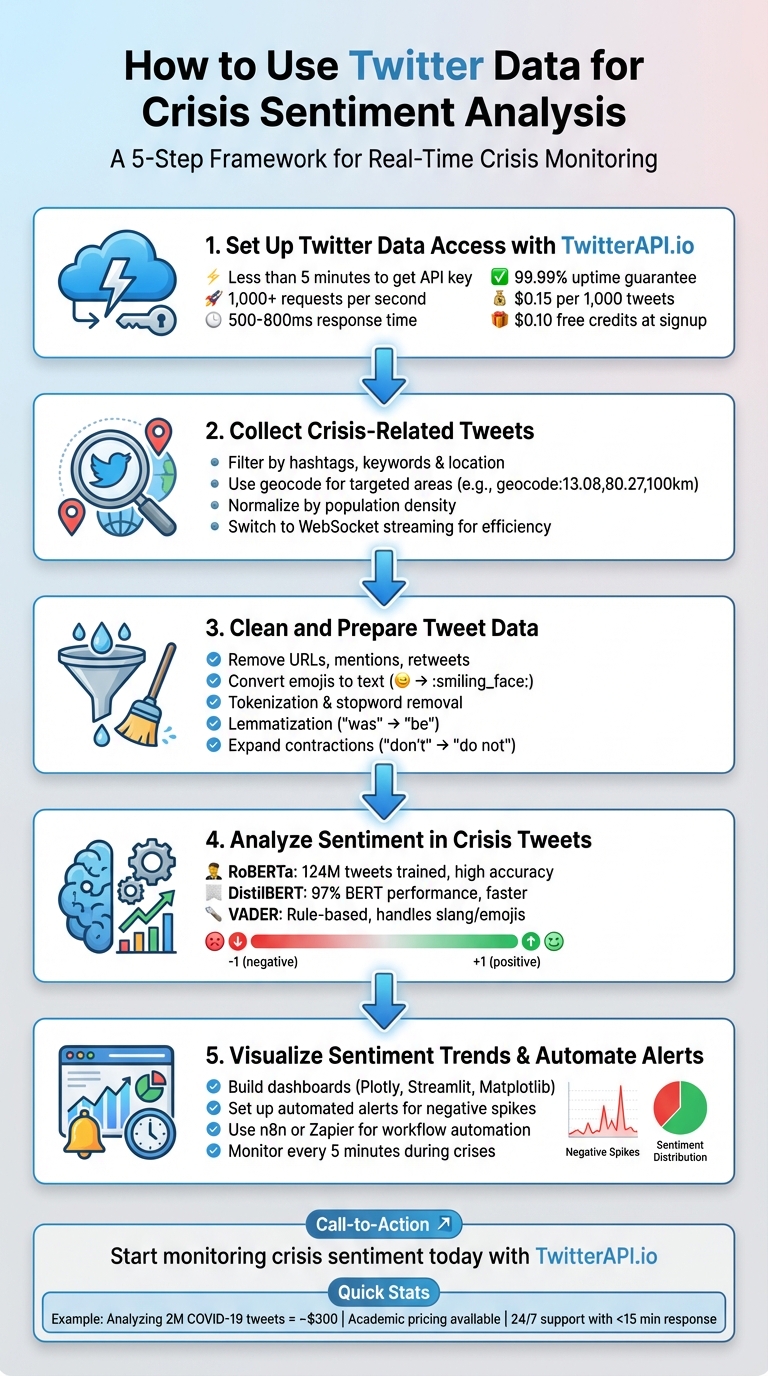
5-Step Process for Twitter Crisis Sentiment Analysis
Twitter Sentiment Analysis Machine Learning Project | Live Twitter API | NLP Series | Project#9
sbb-itb-9cf686c
Step 1: Set Up Twitter Data Access with TwitterAPI.io
Getting started with TwitterAPI.io is quick and straightforward - it takes less than five minutes to access your API key. Head over to twitterapi.io, click "Sign Up", and create an account by entering your email and password. Once you verify your email, you'll see your API key on the dashboard. This key is your gateway to pulling crisis-related tweets.
Make sure to store your API key securely in a .env file using the python-dotenv library. Avoid hardcoding or exposing it in your code. For authentication, include the x-api-key header in every request you make.
Here’s why TwitterAPI.io stands out for managing crisis data effectively.
Why TwitterAPI.io Is Ideal for Crisis Data Analysis
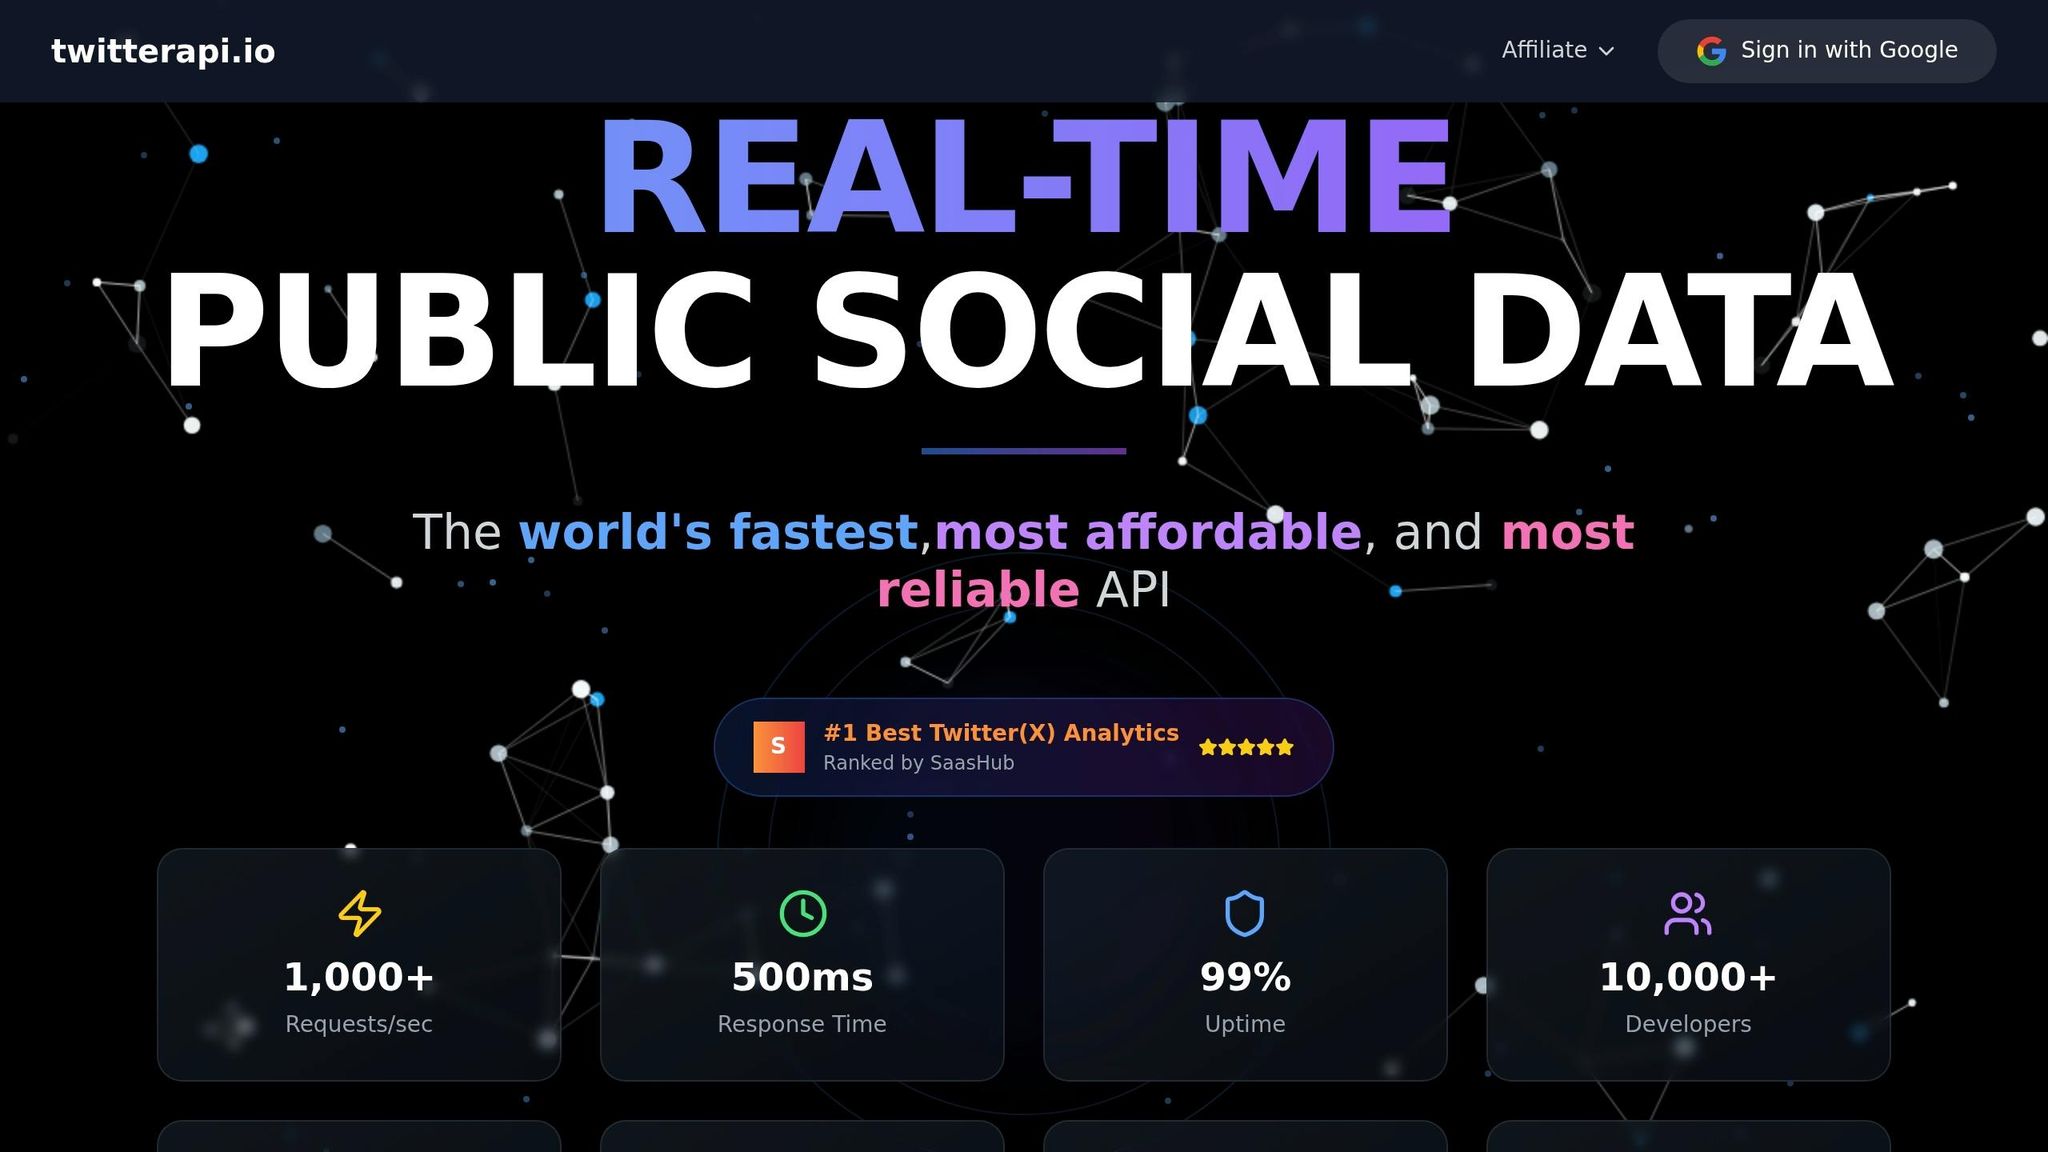
TwitterAPI.io is built to handle the intense data demands of crisis monitoring. The platform supports over 1,000 requests per second, with response times averaging between 500–800ms. It also guarantees 99.99% uptime, ensuring reliable performance during critical events. With infrastructure spanning more than a dozen regions, it’s equipped to manage the massive influx of tweets that often accompany emergencies.
The pricing is pay-as-you-go, starting at $0.15 per 1,000 tweets. For example, analyzing 2 million tweets about COVID-19 would cost around $300. Plus, new users receive $0.10 in free credits at signup, letting you test the platform right away. If your monitoring needs grow during a crisis, you only pay for the additional usage. Additionally, the 24/7 live chat support with response times under 15 minutes is invaluable for fine-tuning queries in fast-changing situations.
Developer Integration Steps
To use the REST endpoints, install the requests library (pip install requests), authenticate with your API key, and start querying crisis-related tweets. Here’s an example of how to search for tweets:
import requests

url = "https://api.twitterapi.io/v1/tweets/search/recent"
headers = {"x-api-key": "YOUR_API_KEY"}
params = {"query": "#CrisisEvent lang:en", "max_results": 100}

response = requests.get(url, headers=headers, params=params)
tweets = response.json()
The response includes JSON data with tweet text, timestamps (formatted as MM/DD/YYYY), and user details - perfect for feeding into sentiment analysis tools.
For real-time streaming, follow these steps: Install the websocket-client library (pip install websocket-client), authenticate using the token parameter, and subscribe to rules for crisis-related tweets. Here's an example setup:
import websocket

def on_tweet(ws, data):
    print(data['text'])

ws = websocket.WebSocketApp(
    "wss://stream.twitterapi.io/v1/tweets?token=YOUR_API_KEY",
    on_message=on_tweet
)
ws.run_forever()
This configuration processes about 1,000 tweets per second, providing live data for your analysis pipeline. Be sure to implement error handling using try-except blocks and exponential backoff (e.g., time.sleep(2**attempt)) to manage issues like rate limits or connection errors. Start with small queries to test your setup before scaling up to handle large volumes of crisis data.
Step 2: Collect Crisis-Related Tweets
Once your API access is ready, the next step is finding the right tweets. Accurately monitoring crises requires carefully crafted queries to capture relevant conversations. You'll need to use hashtags, keywords, geographic filters, and mentions to focus on the most important data. The goal is to collect tweets that provide meaningful insights into the crisis at hand.
Filter Tweets by Hashtags, Keywords, and Location
Start by identifying keywords specific to the crisis. For natural disasters, this might include terms like "earthquake", "flood", or "urgent." For health emergencies, look for terms such as "outbreak", "vaccine", or "hospital." Pair these with hashtags (e.g., #CrisisEvent) and language filters like lang:en to refine your results.
Geographic filtering is crucial when a crisis is confined to certain areas. Use the geocode:latitude,longitude,radius parameter to collect tweets from affected regions. For instance, geocode:13.08,80.27,100km retrieves tweets within 62 miles of Chennai, India. Twitter determines location using GPS, "Twitter Places" tags, or profile data, though this is limited to recent tweets.
For larger or irregularly shaped areas, you can use a hexagonal grid approach with tools like Uber's H3 library. This method allows you to run multiple queries and fill in gaps in historical data. A practical example of this was in April and May 2021, when the Bellingcat Investigative Tech Team used queries like (urgent OR help) AND geocode:[coords],[radius] to map medical shortages during India's COVID-19 crisis.
When analyzing tweets, it’s important to normalize by population density. A high volume of tweets from a crowded city might not signify a more severe situation than fewer tweets from a rural area. To account for this, calculate a baseline for each geographic cell to adjust for these differences.
Once you’ve optimized your queries, make sure to manage API rate limits effectively to keep the data flowing.
Manage API Rate Limits
Efficient data collection is key for real-time crisis monitoring. Instead of constant polling, consider switching to streaming for better efficiency. Traditional REST APIs require frequent requests, which can quickly exhaust rate limits. A WebSocket connection through TwitterAPI.io, on the other hand, creates a persistent link where data is pushed to you instantly. This approach eliminates the need for repeated HTTP requests and allows you to process up to 1,000 tweets per second without exceeding limits.
For WebSocket connections, implement reconnection logic with a 90-second delay if the connection drops. Use ping/pong mechanisms to keep the connection active and monitor its health. This ensures a steady stream of tweets, especially when events unfold rapidly.
If you’re using REST endpoints for batch data collection, adjust your check intervals based on activity levels. During peak crisis moments, check every 5 minutes. When things slow down, extend intervals to 30 minutes. This approach balances data freshness with API credit usage. To maximize the data returned per call, combine multiple keywords in a single query, like (earthquake OR aftershock OR rescue) lang:en.
Store the tweets you collect in a database suited to your analysis needs. Here are some options:
- MongoDB: Ideal for handling varied tweet formats with its flexible JSON schema.
- PostgreSQL: Great for running complex queries and examining relationships between data points.
- Elasticsearch: Best for fast text searches, which is useful for real-time monitoring.
- Redis: Perfect for in-memory speed when building dashboards or caching data.
Step 3: Clean and Prepare Tweet Data
After collecting tweets via an API, the next step is preparing the data. Raw tweets often contain elements like URLs, mentions, retweets, emojis, and slang, all of which can distort sentiment analysis. Proper preprocessing ensures that this raw data is transformed into meaningful inputs, making sentiment analysis more reliable - especially in critical situations like emergencies. By eliminating unnecessary noise and standardizing the text, you can help your tools better interpret emotional content.
Remove Unnecessary Elements from Tweets
Start by stripping out elements that don’t contribute to sentiment. For instance, you can remove URLs using Python's regular expression library with a command like re.sub(r'http\\S+', '', text). Similarly, mentions can be removed with patterns such as @\S+. While hashtags often contain valuable context, it’s a good idea to remove the # symbol while keeping the text itself. If your data includes HTML tags from web scraping, libraries like BeautifulSoup (with the lxml parser) can clean these effectively.
It’s also important to remove retweets to avoid skewing your analysis with duplicate sentiments. Since geo-tagged tweets make up less than 1% of total tweets, careful attention to duplicate removal is essential for accurate sentiment mapping.
If your dataset spans multiple languages, language detection tools like langdetect can help filter tweets by language. Once filtered, non-English tweets can be translated into English using tools like the Google Translate API via the googletrans library. This ensures a consistent language base for analysis.
Prepare Text for Sentiment Analysis
Once cleaned, the text needs to be normalized for analysis. Start by converting all text to lowercase, which ensures uniformity. Expand contractions (e.g., turning "don't" into "do not") using the contractions library, and replace common abbreviations like "rn" with their full forms, such as "right now". Use regular expressions to reduce repeated characters (e.g., "sooooo" becomes "soo") while maintaining the emphasis for sentiment detection.
Emojis are another critical element. Instead of removing them, convert them into text using emoji.demojize(). This retains their emotional context, which is especially important when analyzing crisis-related tweets.
"Text preprocessing involves transforming raw text into a format that is easier to work with, reducing noise and irrelevant information, and enhancing the quality of sentiment analysis results".
Next, tokenize the text by breaking it into individual words using tools like nltk.tokenize or spaCy. Remove common stopwords such as "the", "is", and "and" with nltk.corpus.stopwords to focus on words that carry sentiment. Finally, apply lemmatization using tools like WordNetLemmatizer to reduce words to their base forms (e.g., "was" becomes "be" and "mice" becomes "mouse"). This step helps group similar words together, improving frequency analysis.
| Preprocessing Step | Action | Recommended Python Tool |
|---|---|---|
| URL Removal | Strip http and www links |
re (Regular Expressions) |
| Demojization | Convert 😊 to :smiling_face: |
emoji library |
| Tokenization | Split sentences into word lists | nltk.tokenize or spaCy |
| Stopword Removal | Remove common words (e.g., a, an, the) | nltk.corpus.stopwords |
| Lemmatization | Convert "was" to "be", "mice" to "mouse" | WordNetLemmatizer |
| Contraction Expansion | Convert "don't" to "do not" | contractions library |
Step 4: Analyze Sentiment in Crisis Tweets
Once your Twitter data collection has been cleaned, the next step is to classify the sentiment of each tweet. Cleaned data ensures more reliable sentiment analysis, allowing you to determine whether tweets convey positive, negative, or neutral emotions. This process transforms raw text into actionable insights, enabling quicker and more informed crisis management.
Apply Pre-Trained Sentiment Models
Fortunately, you don’t have to create sentiment analysis algorithms from scratch. Pre-trained models are available and can quickly classify tweet sentiment. For example, RoBERTa, particularly the twitter-roberta-base-sentiment-latest version, is trained on about 124 million tweets and provides real-time insights for social media sentiment analysis.
If speed and efficiency are priorities, DistilBERT is a great option. It’s a lighter, faster alternative to BERT while maintaining around 97% of its performance. For a simpler, rule-based method, VADER (Valence Aware Dictionary and sEntiment Reasoner) works well with tweets, as it handles emojis, capitalization, and slang effectively. VADER uses a compound score system where a score above 0.05 indicates positive sentiment, and a score below -0.05 reflects negative sentiment.
These models are easy to implement using the Hugging Face Inference API, which eliminates the need for infrastructure management. For larger datasets, using GPU acceleration in platforms like Google Colab can drastically cut down processing time. Additionally, pre-cleaning tweets - removing URLs, mentions, and other noise - can improve model accuracy.
| Model Type | Examples | Best Use Case | Key Advantage |
|---|---|---|---|
| Deep Learning | RoBERTa, DistilBERT | High-accuracy, nuanced detection | Handles complex context and sarcasm |
| Rule-Based | VADER, TextBlob | Quick, lightweight analysis | Manages slang and emojis without training |
| Classic ML | Naive Bayes, SVM | Simple classification tasks | Fast processing for straightforward tasks |
Once you’ve chosen the right model, the next step is to quantify sentiment using numerical scores.
Generate Sentiment Scores
Using the outputs from your chosen model, assign numerical scores to measure the intensity of sentiment. Most models provide a polarity score ranging from -1 (highly negative) to +1 (highly positive), with 0 representing neutral sentiment. Some also include a confidence metric to help filter out uncertain predictions. Tools like TextBlob can even provide a subjectivity score, ranging from 0 (completely objective) to 1 (highly subjective).
To make sense of these scores, compare them against your organization’s historical sentiment baseline. For instance, a 20% negative sentiment rate might be normal for some brands but could indicate a crisis for others. Instead of focusing solely on raw counts, track the ratio of negative tweets to total mentions. This approach remains reliable even during periods of heightened activity. Additionally, filtering out retweets ensures you’re analyzing unique opinions rather than amplified content.
A study conducted between 2022 and 2023 by researchers at Conestoga College and Wilfrid Laurier University analyzed 31,000 conflict-related tweets using both Naive Bayes and Neural Network models. The Neural Network achieved 100% accuracy in sentiment prediction, while Naive Bayes reached 80%, highlighting the importance of selecting the right model for critical analyses.
Pair sentiment scores with word frequency analysis to identify recurring negative themes. For example, during United Airlines’ April 2017 PR crisis, sentiment analysis of #UnitedAirlines tweets from April 3–16 showed a spike in negative mentions on April 10. Words like "passenger" and "overbook" were frequently used, pointing to key issues. Similarly, in May 2020, American Airlines faced backlash after a viral video showed a crowded plane with no mask compliance. Tweets described the situation as "unsafe", contributing to a surge in negative sentiment.
Step 5: Visualize Sentiment Trends Over Time
Once you've quantified sentiment, the next step is to turn those numbers into visual insights. Why? Because raw data alone doesn’t tell the full story. Visualizing sentiment trends helps you uncover patterns, spot anomalies, and, most importantly, react quickly during a crisis. For instance, a sudden spike in negative sentiment could signal a brewing issue that demands immediate attention.
Build Sentiment Dashboards
Start by converting tweet timestamps into datetime objects using pd.to_datetime() on the tweet_created field. This lets you analyze sentiment patterns by hour or day - critical for understanding when a crisis starts to unfold.
To make this data actionable, use tools like Plotly, Streamlit, Matplotlib, or Seaborn to create visualizations. Here’s how you can use them:
- Line Graphs: Perfect for tracking changes in sentiment polarity over time.
- Heatmaps: Great for identifying patterns across specific time periods or regions.
- Interactive Dashboards: Streamlit, in particular, is a handy tool for building dashboards that allow real-time interaction. Add sliders to filter by time range, dropdowns to compare categories, and even use
st.mapto visualize where negative sentiment is concentrated geographically.
"Building dashboards to see the data in a graphical way can make things easy because we can see the data in the form of graphs and numbers to get a clear picture." - Uppu Rajesh Kumar, Data Science Enthusiast
A great example of this comes from Federico Pascual of Hugging Face, who analyzed tweets about the brand Notion in July 2022. Using the twitter-roberta-base-sentiment-latest model, he reviewed 1,000 tweets mentioning @NotionHQ. His findings? Positive sentiment made up 49.8%, while 8.2% was negative. Word clouds revealed that positive sentiment revolved around terms like "notes" and "cron", while negative sentiment was tied to words like "figma" and "enterprise" accounts. This kind of visualization provided a detailed understanding of what was driving both praise and complaints.
For those without coding expertise, no-code tools like Zapier combined with Google Sheets can also help visualize basic trends.
Identify Sudden Sentiment Changes
Once your dashboard is up and running, the focus shifts to detecting sudden changes in sentiment. Set up automated alerts that trigger when negative sentiment surpasses a certain threshold. This real-time monitoring can be a game-changer.
"By implementing a sentiment analysis model that analyzes incoming mentions in real-time, you can automatically be alerted about sudden spikes of negative mentions." - Federico Pascual, Hugging Face
To dig deeper into the cause of these shifts, generate word clouds from the negative sentiment subset. Look for recurring keywords like "outage", "bug", or "frustration" to pinpoint the source of the problem.
It’s important to compare these trends against your organization’s historical data. What might seem like a dramatic spike could simply fall within normal variation for your brand. Faceted histograms in Plotly Express can help you compare sentiment trends across regions, time periods, or categories for a clearer picture. Instead of focusing solely on raw counts, track the ratio of negative tweets to total mentions - this approach offers a more accurate measure, especially during times of increased activity.
Integrate Sentiment Analysis into Crisis Response
Once your sentiment pipeline and dashboards are set up, the next step is automating alerts to handle crises in real-time. During high-pressure situations, manual monitoring just doesn’t cut it. Automated alerts ensure you can respond immediately, leveraging real-time insights without delay.
Automate with Workflow Tools
Workflow automation tools like n8n and Zapier can connect TwitterAPI.io with sentiment analysis models and notification platforms, creating a fully automated pipeline. For example, you can configure a Cron trigger in n8n to check TwitterAPI.io every 5 minutes during a crisis. Use an HTTP Request node to fetch tweets related to the crisis, then pass the text to an OpenAI or Google Cloud Natural Language API node for sentiment classification. To ensure swift action, add a conditional IF node that sends notifications via Slack or Microsoft Teams if sentiment drops below -0.05.
"By implementing a sentiment analysis model that analyzes incoming mentions in real-time, you can automatically be alerted about sudden spikes of negative mentions." - Federico Pascual, Hugging Face
Pro Tip: Avoid duplicate alerts by including a filter that checks stored tweet IDs before sending notifications. For long-term use, store all processed tweets and their sentiment scores in a structured database. This not only helps with historical analysis but also supports post-crisis reporting. If you’re managing multiple data sources beyond Twitter, n8n is ideal for building complex ETL pipelines with tools like MongoDB or BigQuery. On the other hand, Zapier offers a simpler setup, connecting over 5,000 apps with minimal coding.
Select the Right TwitterAPI.io Plan
With your automated pipeline ready, the next step is choosing a TwitterAPI.io plan that matches your needs. Here’s a quick breakdown:
| Plan | Pricing | Best For |
|---|---|---|
| Pay-as-you-go | $0.15 per 1,000 tweets | Small-scale monitoring or occasional crisis tracking |
| Academic | Custom pricing (requires .edu email) | Students and researchers studying crisis data |
| Enterprise | Custom pricing | Large-scale operations needing custom rate limits and support |
For most crisis response teams, the pay-as-you-go plan offers flexibility without requiring upfront investment. If you’re handling a high-volume crisis with thousands of tweets pouring in every hour, the Enterprise plan is better suited - it provides custom rate limits and a dedicated account manager to keep things running smoothly. Meanwhile, academic researchers can benefit from special pricing with proof of enrollment, making it easier to study crisis communication patterns effectively.
Conclusion
Tracking crisis sentiment effectively involves a combination of accessing, cleaning, analyzing, and automating data. By following a clear five-step process - from setting up data access to implementing automatic alerts - you can build a system that delivers fast, actionable insights during critical moments.
TwitterAPI.io simplifies this entire process. With instant API access and infrastructure built to handle high tweet volumes during crises, it eliminates the delays of traditional setups. You can start gathering crisis-related data immediately with just an API key.
The standout feature here is automation. Automated tools streamline data collection and enable quick responses. Pre-trained models ensure accurate sentiment classification, no machine learning expertise required. Plus, integrating with tools like n8n or Zapier allows for real-time alerts as sentiment changes, giving your team the edge to react before situations escalate.
Whether you're monitoring natural disasters, managing brand reputation during a PR crisis, or analyzing public health emergencies, the methods and tools discussed here equip you to respond to sentiment data quickly and effectively. Start small with a pay-as-you-go plan to test your setup, and scale up to Enterprise as your needs expand.
Be ready - crises don’t wait.
FAQs
How do I pick the right search query for a crisis?
When dealing with a crisis, selecting the right search query is all about precision. Focus on specific keywords, hashtags, or account filters that directly relate to the event. For example, use terms tied to the crisis, apply location filters to narrow results, or monitor key accounts that are central to the situation.
To make your search more effective, refine your queries with operators and rules. This helps cut through irrelevant data, making it easier to identify trends, monitor sentiment, and stay on top of the situation without being overwhelmed by noise.
How can I handle sarcasm and slang in tweets?
Handling sarcasm and slang in crisis sentiment analysis can be tricky, but there are ways to tackle this challenge effectively. Using specialized sarcasm detection datasets, particularly those built from social media content, can make a big difference. These datasets are tailored to capture the nuances of informal language and tone.
On top of that, advanced natural language processing (NLP) models fine-tuned specifically for casual or informal language can significantly boost accuracy. Pairing sarcasm detection with sentiment analysis creates a more comprehensive approach, enabling better interpretation of tweets and posts during crises. To stay relevant, it's also crucial to keep models updated with the latest data trends. This ensures they remain effective in capturing evolving slang and sarcasm patterns.
What’s a good threshold for triggering alerts?
When setting up alerts for crisis sentiment analysis, the right threshold depends heavily on the context and the volume of tweets you're monitoring. Focus on identifying notable shifts, such as sudden spikes in activity or sentiment changes.
To fine-tune your alerts, configure thresholds based on specific keywords, hashtags, or even activity from certain accounts that exceed normal baseline levels. Using historical data can help you dynamically adjust these thresholds, reducing the chances of false alarms while still catching important developments.
Tags
Related articles
Ready to get started?
Try TwitterAPI.io for free and access powerful Twitter data APIs.
Get Started Free