Twitter Trends API
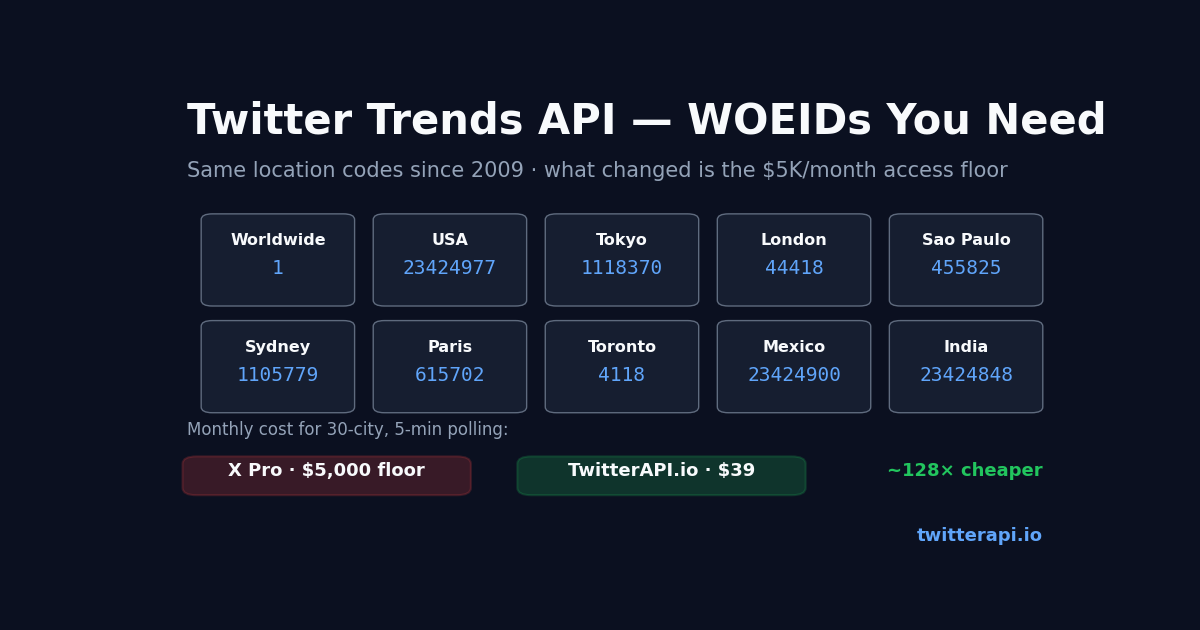
The Twitter Trends API — the endpoint that returns the list of trending topics for a specific location — has been around so long that the location codes it uses pre-date Twitter itself. WOEID (Yahoo's Where-On-Earth ID system) was built in the 2000s for Yahoo Pipes and never went away. The endpoint built on top of it has been part of the Twitter API since v1.0. Every Twitter dashboard, every brand-monitoring tool, every social-listening product that shows "trending in NYC right now" hits this endpoint.
In 2026 the WOEID system itself is unchanged — Worldwide is still 1, USA is still 23424977, Tokyo is still 1118370. What changed is access to the endpoint. The official X Trends API now requires the Pro tier ($5,000/month minimum, with the February 2026 hybrid pricing layered on top — 2,000,000 Post-reads/month account cap + per-resource overage). The endpoint that powered every basic "trending now" widget for fifteen years is now firewalled behind enterprise-level commitment.
This page covers what "Twitter Trends API" means in 2026: what survived (WOEID, the endpoint shape), what changed (the tier wall and the cap), the official endpoint signature, the WOEID reference table you actually need, and a working alternative that doesn't require Pro tier or a $5,000/month floor.
What the Trends API Returns
A Trends API call takes a single parameter — a WOEID — and returns the list of currently-trending hashtags and phrases for that location, ranked roughly by velocity. A typical response is 50 trends, each with the topic string, the URL it links to on X, an estimated tweet-volume number (when available), and sometimes a context object describing why the trend appears in that location.
The endpoint is read-only and idempotent — call it as often as you like, you get the latest snapshot of the trending list for that WOEID. Trends refresh server-side roughly every 5 minutes; polling more often than that doesn't get you fresher data, only more bills.
Common use cases that have not changed since 2016: real-time content discovery for editorial teams, brand-safety monitoring (is my brand trending unexpectedly?), seed-keyword generation for SEO and ad workflows, sentiment tracking starting points, dashboard widgets for marketing teams. None of those use cases got easier in 2026; the data is just behind a higher wall.
WOEID — The Location System You Need
WOEID stands for Where-On-Earth Identifier, originally Yahoo's geocode system. Twitter adopted it in early v1 and never replaced it — the codes are stable, well-documented, and cover every country, every US state, and most major cities worldwide. WOEIDs are integers, typically 5-8 digits long.
The single most useful WOEID is 1 — Worldwide. Calling the Trends API with woeid=1 returns the trending list across all of X, not filtered to any country or city. Most analytics dashboards start here.
Country and city WOEIDs you'll use most:
The complete list of supported WOEIDs is roughly 500 — every major metro area plus every country. Locations not in the supported set return an empty trends list rather than an error.
Official X Trends API — What It Looks Like in 2026
On the X v2 surface the endpoint is GET /2/trends/by/woeid/{woeid}. The path takes the WOEID as a URL parameter (not query), authorization is a bearer token, and the response is JSON.
Tier requirement: Pro ($5,000/month) or Enterprise. Trends are not included in Basic ($200/month) or the Free read tier. This is the change that brings most teams to this page — pre-2024 the trends endpoint was effectively free; in 2026 it has the same access floor as full historical search.
Hybrid pricing impact: every trends call counts toward the 2,000,000 Post-reads/month account cap. A trends call doesn't return Posts directly — it returns trend metadata — but in the 2026 model it bills against the same monthly account quota. A team polling trends for 20 locations every 5 minutes (288 calls/day × 20 = 5,760 calls/day × 30 days = 172,800 calls/month) won't blow the cap, but combined with any other read workload on the same account, the trends polling becomes part of the overall cap math.
Rate limit: the per-window rate limit on the trends endpoint is generous on Pro — typically 75 requests per 15 minutes per account. The bottleneck is rarely the per-window rate limit; it's the monthly cap and the tier floor.
Why Most Teams Don't Use the Official Trends API in 2026
The economics fail for nearly every use case smaller than a top-50 newsroom or an enterprise social-listening platform. A small editorial team that wants "trending in 5 cities every 15 minutes" is looking at a $5,000/month minimum spend for what is functionally a 50-item JSON response refreshed every 5 minutes server-side.
Three failure modes are common with the official path:
Tier mismatch. A side project, an indie analytics tool, a startup's MVP — all need a $200-500/month budget for data, not $5,000+. The Free-to-Pro jump on X has no middle tier for trends.
Polling-cost mismatch. Trends update every 5 minutes server-side. To stay current you poll every 5 minutes per WOEID. For 30 cities that's ~260,000 calls/month — well under the 2M cap on its own, but when combined with any other read workload (search, user info, timelines), the cap binds.
Visibility mismatch. The official endpoint returns no historical trend data — only the current snapshot. To track "what was trending yesterday at 3pm in Tokyo" you have to poll continuously and persist the snapshots yourself. That polling cost compounds against the tier floor.
TwitterAPI.io Trends Endpoint — Same Shape, No Tier Wall
The third-party path most teams move to is TwitterAPI.io's /twitter/trends endpoint. The signature is intentionally similar to the official one — take a WOEID, return the trend list — so existing code that assumed the official shape ports over with a base-URL swap.
Endpoint: GET https://api.twitterapi.io/twitter/trends?woeid={woeid}. Auth is X-API-Key header. Required param is woeid. Optional params include count limit and locale modifiers (see docs.twitterapi.io for the current set).
Pricing: flat $0.00015 per request. No tier system, no monthly cap, no $5,000 floor. A team polling 30 cities every 5 minutes (~260,000 calls/month) costs about $39/month total. Same workload on official X Pro costs $5,000/month minimum.
Same WOEID system: the WOEID values are unchanged across both APIs — Worldwide=1, USA=23424977, Tokyo=1118370. The lookup table above works as-is.
Response shape: trends list per location, each with the topic string, tweet count where available, and the X URL the trend resolves to. Direct one-for-one swap with the official v2 response for the fields most dashboards use.
When to Use the Official Trends API
Two scenarios where the official Pro-tier path is the right choice:
You already have a Pro account for other workloads. If your team is already on $5,000/month Pro for historical search or streaming, the trends endpoint is included — there's no additional cost beyond what you're already paying, and the cap math is just shared across all your reads.
You need official X branding compliance. Some enterprise data licensing terms require that data come from the official X API surface (compliance with internal data-source policies, contractual obligations to end customers). In those cases TwitterAPI.io is not a substitute regardless of cost.
Outside these two cases, the alternative path tends to win on cost-per-trend-call by a factor of 100×. For most teams the answer is "start on the alternative, move up if compliance demands it."
import os
import time
import requests

API_KEY = os.environ["TWITTERAPI_IO_KEY"]
HEADERS = {"X-API-Key": API_KEY}

# Common WOEIDs — see body for the full table
WOEIDS = {
    "worldwide": 1,
    "usa": 23424977,
    "tokyo": 1118370,
    "london": 44418,
    "sao_paulo": 455825,
    "sydney": 1105779,
}


def get_trends(woeid: int) -> list[dict]:
    """Return the current trend list for a WOEID."""
    r = requests.get(
        "https://api.twitterapi.io/twitter/trends",
        params={"woeid": woeid},
        headers=HEADERS,
        timeout=30,
    )
    r.raise_for_status()
    return r.json().get("trends", [])


# Poll trends for 6 locations every 5 minutes
# Monthly bill: 6 × 288 polls/day × 30 days = 51,840 calls × $0.00015 = ~$7.78
for name, woeid in WOEIDS.items():
    trends = get_trends(woeid)
    print(f"=== {name.upper()} (woeid={woeid}) ===")
    for t in trends[:10]:
        vol = t.get("tweet_volume") or "n/a"
        print(f"  {t['name']}  ·  {vol} tweets")

# In production wrap the above in a loop with `time.sleep(300)` — trends
# refresh server-side every 5 minutes, polling more often returns the
# same snapshot.
Questions readers ask
Does Twitter still have a Trends API in 2026?
Yes — GET /2/trends/by/woeid/{woeid} on the official v2 surface, but it now requires Pro tier ($5,000/month minimum). The endpoint shape and the WOEID location system are unchanged from earlier API generations; what changed is the access floor. Free and Basic tiers do not include trends access.
What is a WOEID?
WOEID stands for Where-On-Earth Identifier — Yahoo's geocode system, adopted by Twitter in early v1 and never replaced. Each supported location has a stable integer code: Worldwide is 1, USA is 23424977, Tokyo is 1118370, London is 44418. The system covers every country plus ~500 major metro areas globally. Codes are stable across both the official X API and third-party alternatives.
How often do Twitter trends update?
Server-side roughly every 5 minutes. Polling the endpoint more often than that returns the same snapshot — you get more bills, not fresher data. For most dashboards a 5-minute poll interval is the right cadence; for editorial discovery workflows a 60-second poll catches the trend the moment it cycles.
How much does the Twitter Trends API cost in 2026?
On official X: the entry tier (Pro) is $5,000/month minimum, with trends calls billing against the same 2,000,000 Post-reads/month account cap as other reads. On TwitterAPI.io: flat $0.00015 per call, no tier and no cap — polling 30 cities every 5 minutes costs about $39/month total. The gap for trend-monitoring workloads is consistently 100× or more in favor of the alternative.
Can I get historical Twitter trends?
Neither the official Trends API nor most third-party trends endpoints return historical trend snapshots — only the current state. To track "what was trending in Tokyo at 3pm yesterday" you have to poll continuously and persist the snapshots in your own database. A 5-minute poll cadence persisted for one year on 10 WOEIDs is roughly 10.5M rows; manageable on PostgreSQL or any time-series store.
Why do some trends show no tweet_volume?
Tweet volume is estimated server-side and only attached to trends above a confidence threshold. Newer or smaller trends typically come through with tweet_volume: null — the trend is real, the volume estimate hasn't accumulated enough signal yet. This behavior is consistent across the official endpoint and most third-party alternatives because both inherit X's underlying confidence model.
Can I get trends for a city not in the WOEID list?
No — the trends system only computes per-location trends for the ~500 WOEIDs in the supported set. Locations outside the set return an empty trends list rather than an error. Smaller cities are aggregated into their containing metro or country WOEID. For a city not in the list, the nearest containing region (usually the country) is the closest approximation available.
Continue
- /
- /blog/twitter-api-pricing
- /blog/twitter-trends
- /blog/twitter-api-trending
- /blog/twitter-search-api-complete-guide-2025
- /pricing
Stop reading. Start building.
Starter credits cover real testing on real data. Google sign-in, no card, no application queue.
Get an API key