Twitter Trends — Find, Track, Automate
Twitter (now X) trends are the platform's real-time pulse: a ranked list of topics seeing a sudden surge in posting volume, refreshed every few minutes. You see them in the side panel on the web and in the Explore tab on mobile. They are location-scoped by default — what trends in the US does not always trend in Japan — and, in the app, partly personalised to you.
Reading trends casually is free and needs nothing. Working with them — tracking them over time, comparing regions, alerting on them, feeding them into research — is where you need the API, because the in-app view shows a short, personalised slice with no history and no export.
This page covers all of it: what the trend list actually is, how to view it, how to pull it through an API with WOEID location codes, what the response does and does not contain, the use cases, and a reference architecture for a trend-alert system that holds up beyond a toy project.
What the Trend List Actually Is
A trend is a topic whose posting volume is accelerating — a sudden surge, not steady popularity. A term a million people tweet evenly every day does not trend; a term that jumps from quiet to loud within an hour does. The list is a velocity signal, not a popularity ranking.
It is location-scoped. Every trend list is computed for a place — worldwide, a country, or a city. The same moment produces different lists in different places.
It refreshes every few minutes. The exact cadence is not published, but in practice the list rotates within roughly five-to-ten-minute windows.
In the app it is personalised. The web and mobile views blend your interests and follows into the selection, so two people in the same city see slightly different lists. The API returns the un-personalised, location-based list — closer to the raw trending list for that region, which is what you want for analysis.
How to View Twitter Trends
On the web: the right-hand sidebar shows the current trends for your selected location. Click "Show more" then the settings control to change the location to another country or city.
On mobile: the Explore tab, Trending section — the same data in a mobile layout.
The limits of the in-app view: you see only about ten to twenty-five trends at once, with no history, no export, and an algorithmically filtered, personalised selection. It is fine for a glance. For anything analytical — a dashboard, an alert, a research dataset, a regional comparison — you need API access, because none of those are possible against a personalised on-screen list.
Pulling Trends Via API
Two routes expose the trend list to code.
The official X API has a trends-by-location endpoint keyed on a WOEID. It is reachable on the official API's paid access — and for a new developer account that now means the metered pay-per-use model, since the old flat hobby tiers are closed to new signups. For a small trend-polling job, the metered official pricing is hard to justify.
A third-party API such as TwitterAPI.io exposes /twitter/trends?woeid={woeid} — you pass a numeric WOEID and get the ranked list back. Billing is pay-per-call with no subscription, which suits trend polling well: a trend job is many small, cheap, repeated calls, not a few large ones.
Either way the shape of the work is the same — pick a location, call the endpoint, read a ranked list. The next sections cover what that list contains and how to turn repeated calls into something useful.
WOEID — the Location System
Trends are addressed by WOEID — "Where On Earth ID" — a stable numeric code for a place. You pass one to the trends endpoint to say which location's list you want.
Worldwide is 1. It is the global list — though in practice it skews toward whichever regions are loudest at the moment, which is often the US.
Countries and cities have their own codes. The United States, the UK, Japan, and several hundred cities each have a WOEID. A country code gives that nation's list; a city code narrows further.
For a real global picture, pull several. Because worldwide is volume-weighted and can be US-skewed, a brand or newsroom tracking genuinely global trends polls a handful of country and city WOEIDs and compares them, rather than trusting 1 alone.
WOEIDs are stable, so you can hard-code the handful you care about once and reuse them.
What the API Returns — and What It Doesn't
What you get: for each trend, its name (the hashtag or phrase), its rank position in the list, and a pre-built search query you can hand straight to a search call to pull the posts behind the trend.
Rank, not volume. TwitterAPI.io's /twitter/trends gives you the rank position, not a tweet count — and rank is the reliable signal anyway. The official API additionally exposes a heuristic tweet_volume estimate, but it is approximate and can be off by a wide margin, so treat it as rough ordering, not a precise count.
Not the posts themselves. The trend list tells you what is trending, not the content. To read the actual posts behind a trend, take that pre-built search query and make a separate search call.
No history. Each call is a snapshot of right now. There is no "trends last Tuesday" endpoint — if you want history, you build it by polling and storing, which the alert architecture below does as a side effect.
Common Use Cases
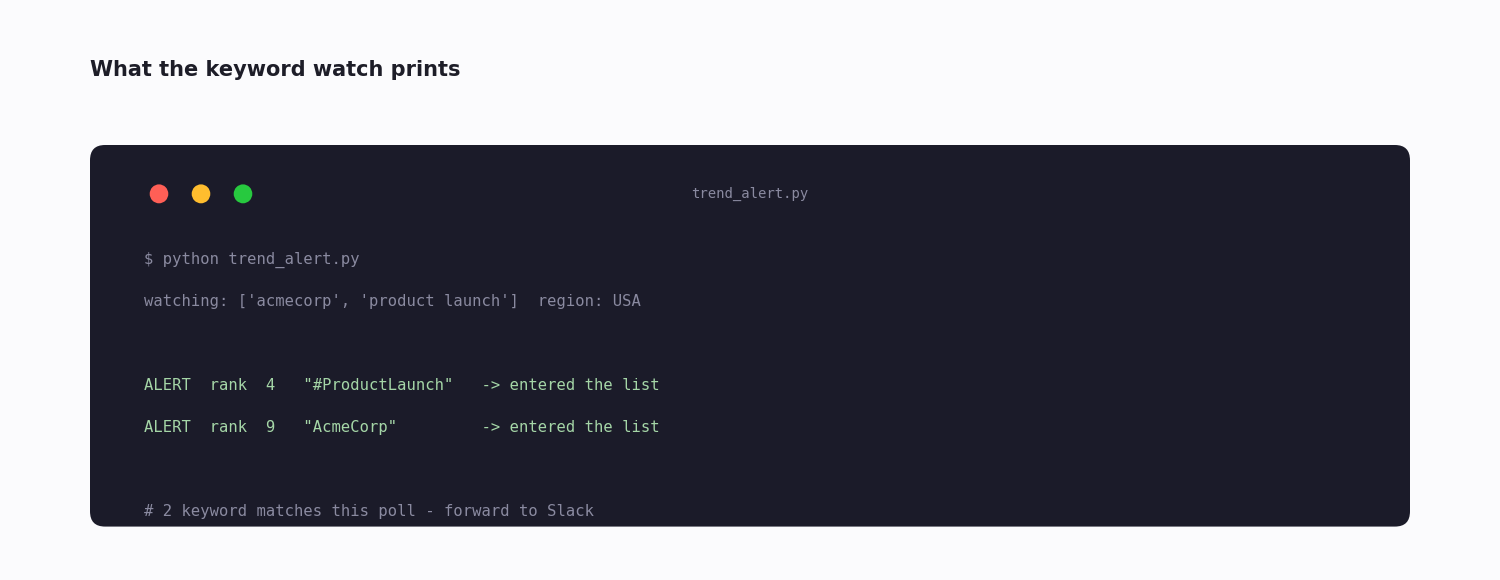
Brand and competitor alerts. Poll trends every few minutes and watch for terms matching your brand, product, or a competitor. A brand term entering the list means you are having a moment — good or bad — and the speed of your response depends on noticing fast.
Content-angle research. Pull the morning's trends, score them against your content calendar, and surface today's relevant topics. Newsletters, podcasts and content teams use this to ride a wave instead of guessing.
Geographic comparison. Pull several cities or countries at once and diff them — what is purely local versus genuinely global. Important for event coverage, sports and politics, where the same hour looks very different by region.
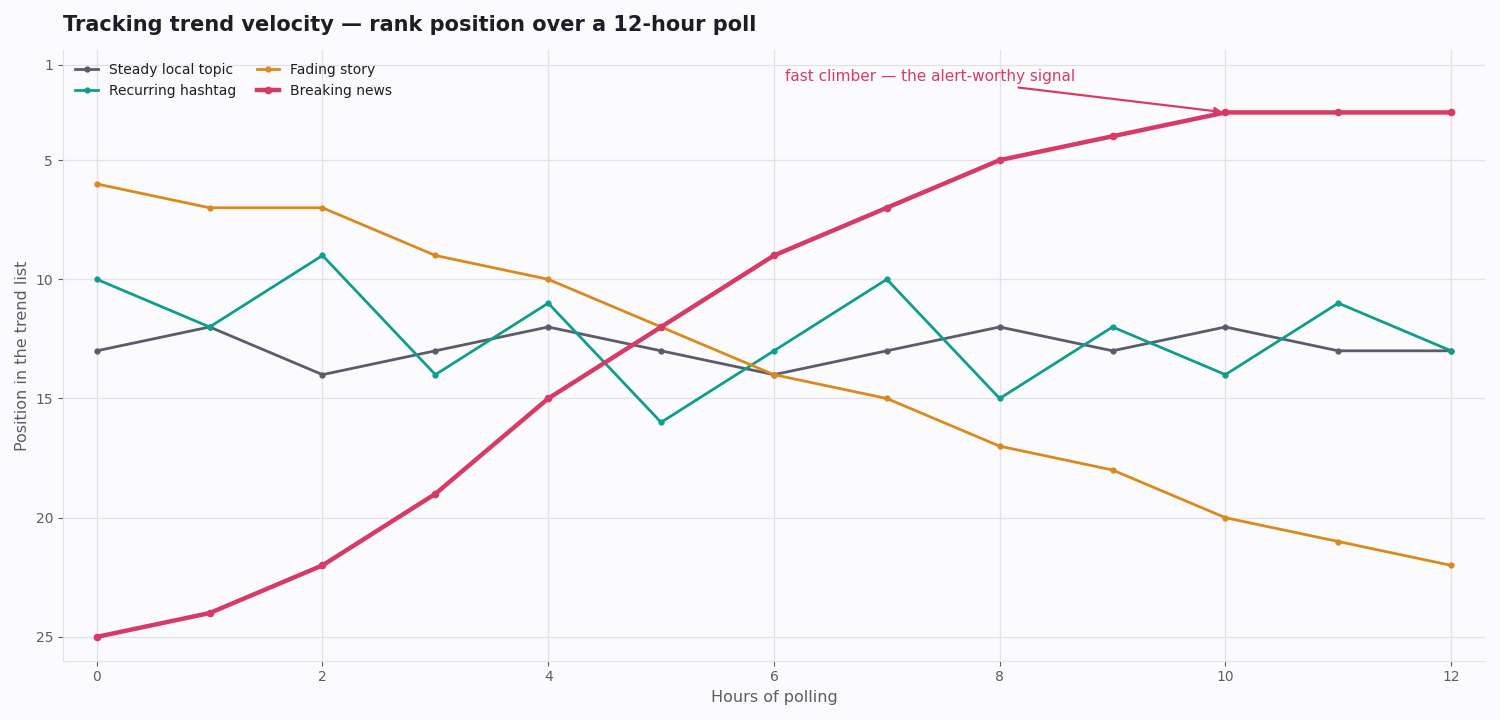
Trend velocity. Store the list every hour and score how fast a term climbs the rankings. A fast climber is usually the most actionable signal — covered in its own section below.
Building a Trend Alert System
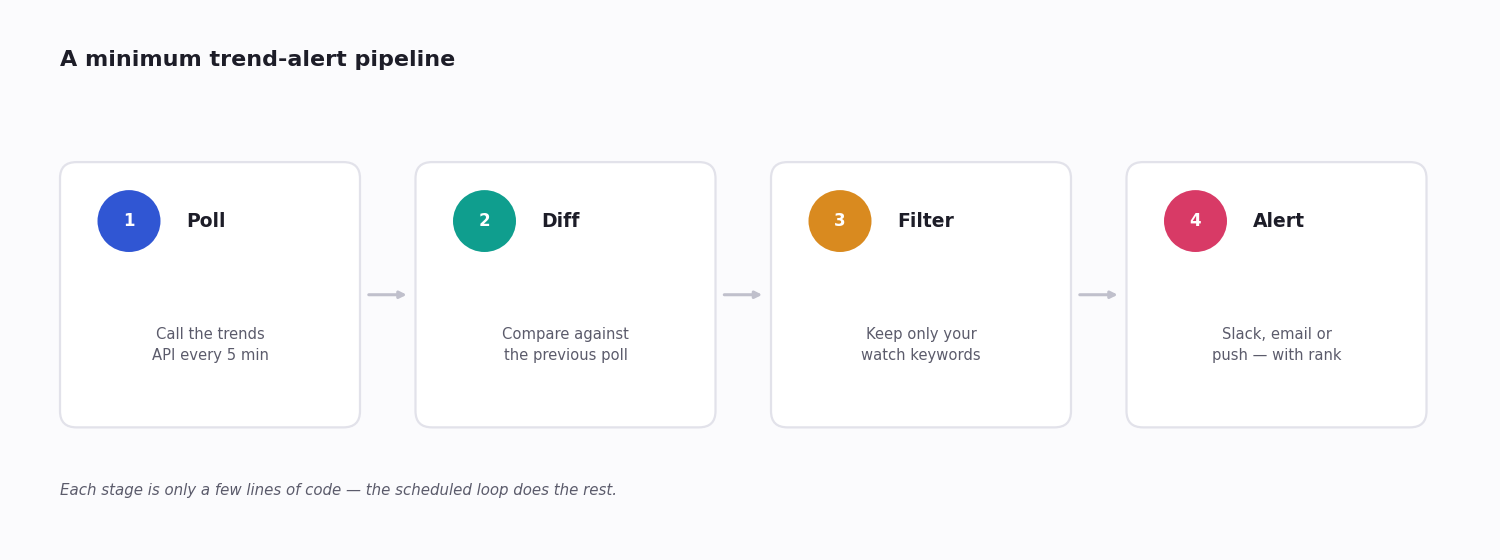
A minimum viable trend alert is four stages, and each is a few lines of code:
1. Poll the trends API every few minutes for the location(s) you care about.
2. Diff the new list against the previous poll — what is new, and what climbed fast in rank.
3. Filter by relevance — your watch keywords, with generic noise excluded.
4. Alert — a Slack webhook, an email, a push — carrying the trend name, its rank, and a link to the posts behind it for context.
Cost at this scale: roughly 12 calls an hour, about 288 a day, around 8,600 a month — a low single-digit monthly bill on a pay-per-call API, small enough to run the testing phase on free trial credit. Monitoring ten-plus cities multiplies the call count by the number of cities and is still an inexpensive per-call bill, with none of the official API's monthly subscription minimum.
Because step 2 needs the previous poll, this architecture stores every poll — which means it also, for free, becomes the trend history the API itself does not give you.
Trend Velocity — Reading the Climb
A single trend snapshot tells you what is trending now. The more useful signal is how fast something is climbing — and that only exists once you keep a history of polls.
Store each poll with its timestamp, then for any term track its rank across consecutive polls. A term moving from rank 25 to rank 3 over a few hours is a different, more actionable story than a term that has sat at rank 8 all day — even though, in a single snapshot, the rank-8 term looks bigger.
Fast climbers are where breaking news, viral moments and emerging crises show up first. A trend-alert system that scores velocity — rank change per hour — rather than just presence catches those while they still matter. The hero chart at the top of this page is exactly that: four trends' rank tracked over a polling window, with the fast climber unmistakable.
Velocity is also the cleaner way to filter noise: a recurring daily hashtag is always "present" but never "climbing," so a velocity threshold quietly drops the routine and surfaces the genuinely new.
Trends Limitations to Know
Four caveats to design around:
Rank, not volume. The reliable number is rank position; the official API's tweet_volume estimate is heuristic and often well off — never report it as a precise figure.
Promoted trends. Some list entries are paid placements. The official API marks them with a promoted_content flag; a third-party list may not expose that flag, so for organic analysis treat unusually brand-heavy entries with care, or cross-check them with a volume search.
Time matters as much as place. Trends are localised in time as well as location — the same place at the same clock hour looks completely different from one week to the next. Always store the timestamp alongside the trend.
No history from the API. Every call is a current snapshot. Historical trend tracking is something you build by polling and storing — there is no shortcut endpoint for it.
import requests
from datetime import datetime, timezone

API_KEY = "your_api_key"
HEADERS = {"X-API-Key": API_KEY}

# WOEID = "Where On Earth ID". 1 = worldwide, 23424977 = USA, 44418 = UK.
def fetch_trends(woeid=1):
    r = requests.get(
        "https://api.twitterapi.io/twitter/trends",
        params={"woeid": woeid},
        headers=HEADERS,
        timeout=30,
    )
    r.raise_for_status()
    # response shape: {"trends": [{"trend": {"name": ..., "rank": ...}}]}
    return [item["trend"] for item in r.json()["trends"]]

def alert_on_keyword(trends, watch_keywords):
    matches = []
    for t in trends:
        if any(kw.lower() in t["name"].lower() for kw in watch_keywords):
            matches.append({
                "trend": t["name"],
                "rank": t["rank"],
                "detected_at": datetime.now(timezone.utc).isoformat(),
            })
    return matches

if __name__ == "__main__":
    trends = fetch_trends(woeid=23424977)  # USA
    alerts = alert_on_keyword(trends, ["acmecorp", "product launch"])
    if alerts:
        # Send to Slack / email / your alert pipeline
        print("ALERT:", alerts)
Questions readers ask
How often do Twitter trends update?
Every few minutes — in practice the list rotates within roughly five-to-ten-minute windows. The exact cadence is not published. A trend reflects a surge in posting volume, so the list changes as those surges rise and fade.
Can I see Twitter trends for any country?
Yes, through the API — pass the WOEID ("Where On Earth ID") for the place you want. A few hundred countries and cities have codes. The in-app view is limited to a personalised regional list, but API access gives full geographic flexibility, including pulling several regions at once to compare them.
What is a WOEID?
WOEID is "Where On Earth ID" — a stable numeric code for a location. Worldwide is 1; countries and cities each have their own. You pass a WOEID to the trends endpoint to choose which location's list you get back. Because the codes are stable, you can hard-code the ones you care about.
Are Twitter trends personalised to me?
In the app, yes — the web and mobile views blend your interests and follows into the selection, so two people in the same city see slightly different lists. The API returns the un-personalised, location-based list, which is the "raw" trending list for that region and the right input for analysis.
Does the trends API return a tweet count per trend?
TwitterAPI.io's /twitter/trends returns each trend's rank position, not a tweet count — and rank is the reliable signal. The official X API exposes a heuristic tweet_volume estimate, but it is approximate and not exact. For an accurate count, run a search for the trend term and paginate the results.
How do I know if a trend is promoted or organic?
Twitter's own list mixes in a few promoted (paid) placements. The official X API flags them with a promoted_content field; a third-party list may return only name, rank and a search query, with no promoted flag. For organic analysis, treat unusually brand-heavy entries with care, or cross-check them against a volume search.
Can I get historical Twitter trends?
Not directly — every API call is a snapshot of the current list, and there is no historical-trends endpoint. To get history you poll the trends endpoint on a schedule and store each result with its timestamp. A trend-alert system does this anyway, so its stored polls become your trend archive.
How much does it cost to track Twitter trends via API?
On a pay-per-call third-party API it is inexpensive: polling one location every few minutes is roughly 8,600 calls a month, a low single-digit monthly bill, with no subscription. Tracking many cities multiplies the call count but stays a per-call bill. The official API, metered per request for new accounts, costs more for the same polling job.
Continue
- /
- /twitter-stream
- /blog/twitter-analytics
- /blog/twitter-api-trending
- /blog/chart-data-twitter
- /pricing
- /twitter-scraper
Stop reading. Start building.
Starter credits cover real testing on real data. Google sign-in, no card, no application queue.
Get an API key