Twitter Analytics — A Practical Walkthrough
Twitter analytics used to mean one dashboard at analytics.twitter.com. That dashboard still exists, but its depth has shrunk over the years — engagement, impressions, top tweets, and a thin slice of audience data. For any team that needs more than "how did this one post do," it runs out fast.
"Twitter analytics" actually splits into four distinct jobs, and which one you mean decides whether the free dashboard is enough or whether you need the API. The built-in dashboard covers your own engagement and reach; competitor benchmarking and a real audience audit need API access, because they need data about accounts you do not own.
This page covers what each tier of Twitter analytics gives you, the metrics that actually predict performance and the ones that quietly mislead, what API-based analytics costs, and how to wire up a simple analytics pipeline when the dashboard is not enough.
The Four Jobs People Call 'Twitter Analytics'
Before picking a tool, it is worth being precise about which question you are actually asking — because the answer decides whether the free dashboard is enough or whether you need the API.
Engagement tracking — how your own posts perform: likes, reposts, replies, clicks. The built-in dashboard does this well.
Reach measurement — impressions, profile visits, link clicks on your own account. Also covered by the built-in dashboard.
Audience growth — followers gained and lost over time, and who those followers are. The dashboard shows totals and a rough demographic sample; a real follower-graph audit needs the API.
Competitor benchmarking — the same engagement and growth metrics, but for accounts you do not own. This is impossible in the built-in dashboard by design, and it is the single most common reason teams reach for API-based analytics.
The Built-In X Analytics Dashboard
Anyone with a free Twitter/X account can see analytics for their own posts in the analytics tab. What it gives you:
Per-post metrics — impressions and engagements (likes, reposts, replies, profile clicks, link clicks, hashtag clicks) for each of your posts. Free accounts see roughly the last month; X Premium extends the history.
Account overview — total impressions, profile visits and new followers for a period, plus a top-post selection. Updated daily, with about a day of lag.
Audience insights — rough breakdowns by location, gender and interests. This is sampled data, not a full census — useful for direction, not for precise targeting decisions.
Kept to your own account, this is honestly enough — free, no setup, and a clear answer to the everyday question of which posts landed.
Where the Built-In Dashboard Stops
The dashboard's limits are not bugs — they are the boundary of what a first-party tool will ever show you:
No data on accounts you don't own. You cannot see a competitor's engagement, a partner's growth, or an influencer's real activation rate — the dashboard only ever reflects your own account.
No raw export. You can read the numbers on screen but cannot cleanly pull them out as CSV or JSON to join against your own data or feed a model.
Shallow history. Older periods drop off; there is no multi-year trend line.
Sampled audience data. The demographic breakdowns are estimates, not the underlying follower list.
Each gap on that list is something the API can fill.
Twitter Analytics via API — Your Account or Anyone's
API-based analytics is just a loop: pull public tweets and profiles, compute metrics yourself, store the result. That unlocks the jobs the dashboard cannot do:
Competitor tracking — pull a rival account's recent posts, compute its engagement rate (weighted engagements divided by followers and post count), and compare it against your own. The numbers are the same metrics the dashboard shows for you — you are just computing them for an account you do not own.
Hashtag analytics — search a hashtag, count post volume over time, and rank the accounts driving it. This is how you measure the real reach of a branded campaign rather than guessing from your own posts.
Follower-graph audit — pull your follower list, look up each follower's account size and recent activity, and separate genuine reach from bots and long-dead accounts. A 100k follower count means little if a third of it is inactive.
Mention sentiment — search your brand name, pull every match, score sentiment, and aggregate over time into a brand-health curve.
The Metrics That Actually Matter
Most analytics mistakes are a choice of the wrong number. The hierarchy that holds up:
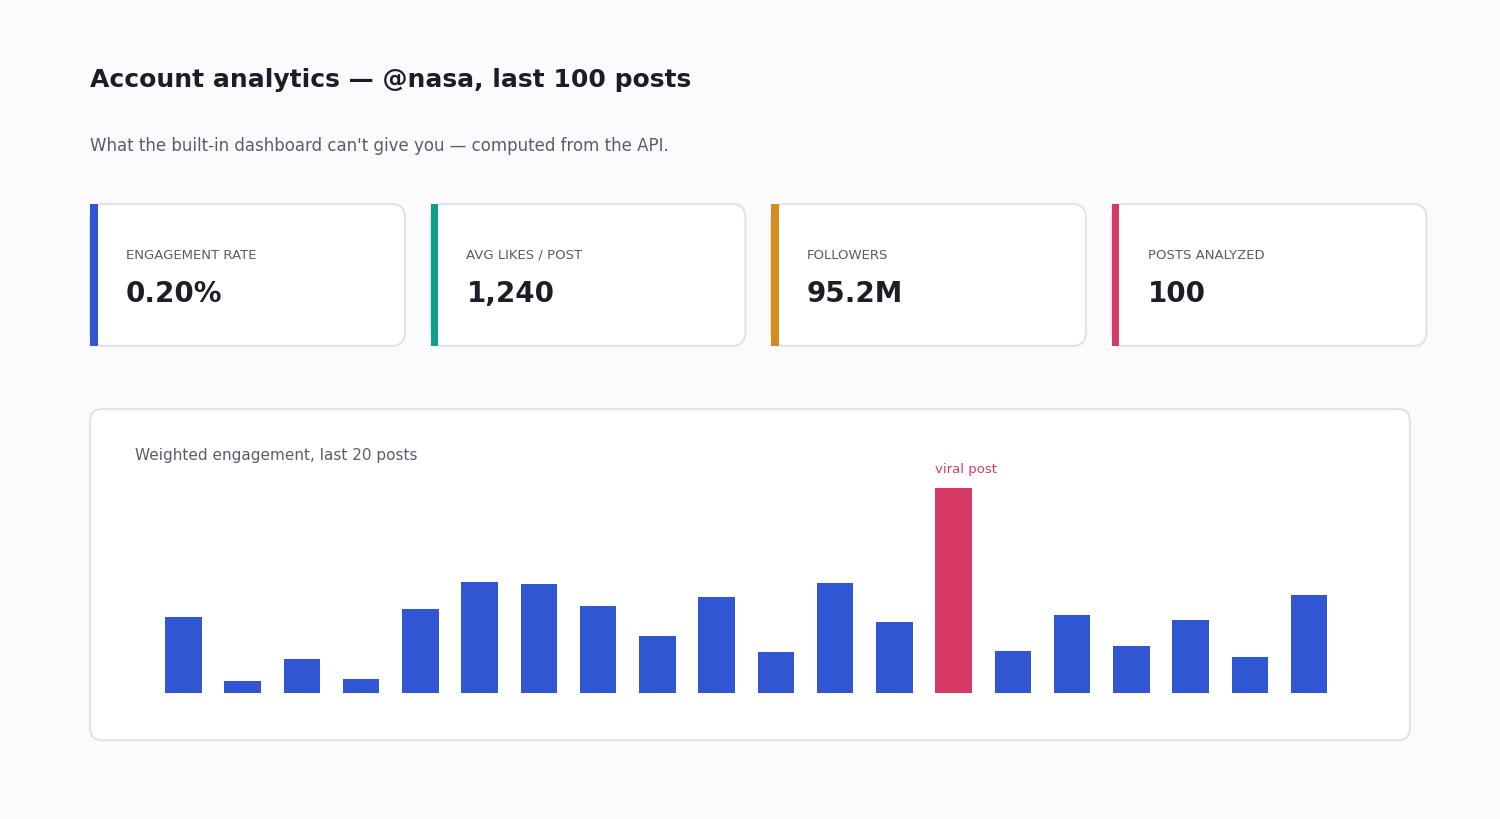
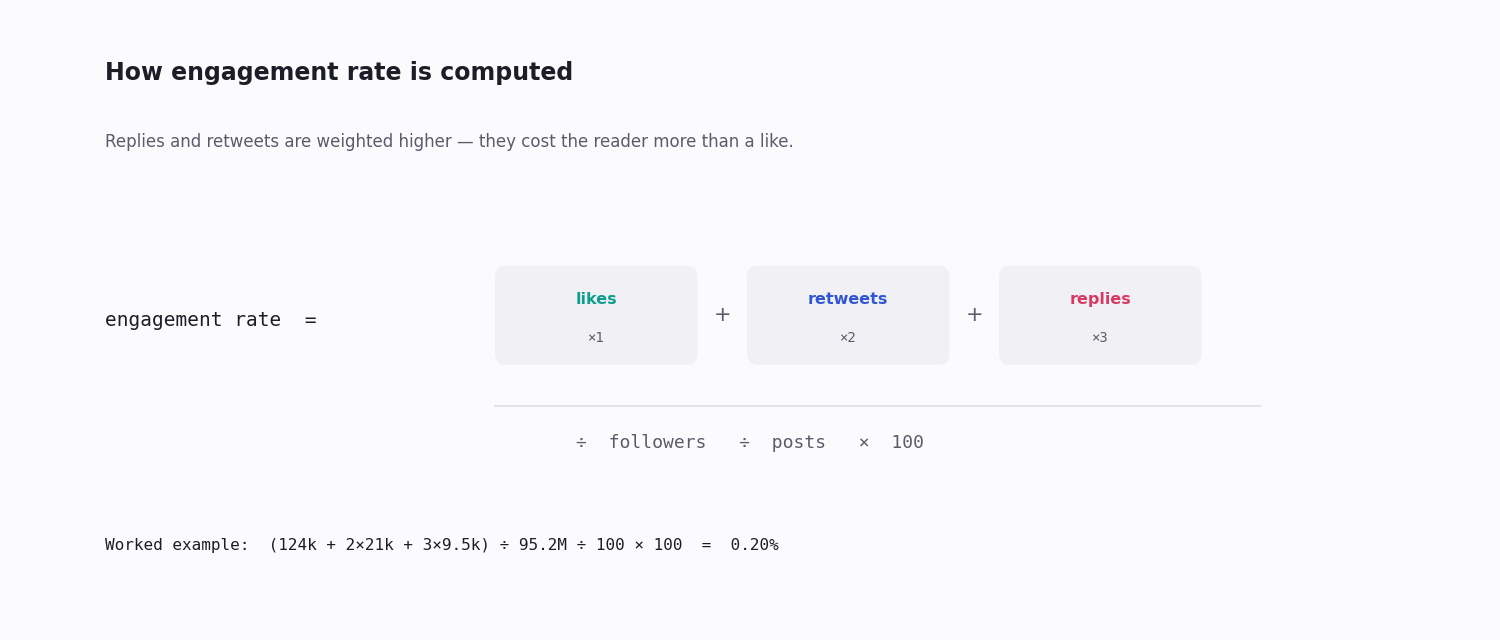
Engagement rate is the headline metric — weighted engagements divided by followers, divided by post count. It normalises for audience size, so you can compare a small account against a large one fairly, and it tracks closely with how far the algorithm carries a post.
Weight the engagement types. A like is cheap; a reply or a repost costs the reader more and signals more. Counting likes alone undercounts your real traction — weighting replies and reposts higher (the formula in the diagram above) gives a truer score.
Impressions are the weakest headline number. They are inflated, easy to game, and say nothing about whether anyone cared. Use them as a denominator, not a goal.
Follower count is a vanity number on its own. It only becomes meaningful next to engagement rate — a 5k-follower account at 5% engagement out-reaches a 100k account at 0.1%.
What API-Based Analytics Costs
Analytics is read-heavy — you pull posts and profiles, you rarely write — so cost comes down to read pricing.
The official X API is now metered pay-per-use for new accounts: billed per post read, with the old flat $200/month Basic tier closed to new signups and Enterprise starting in the tens of thousands per month. For a read-heavy analytics workload, the metered rate adds up quickly.
A third-party pay-per-call API bills about $0.15 per 1,000 tweets, with no subscription. Typical analytics budgets:
Single account, daily refresh — about 100 posts a day, roughly $0.45/month.
Competitor tracking, 20 accounts daily — about 2,000 posts a day, roughly $9/month.
Campaign-hashtag tracking — volume-dependent; a tag drawing 5,000 posts a day costs about $22 to capture every match for a month.
For essentially any analytics workload below a few hundred thousand posts a month, pay-per-call is far cheaper than the official metered rate, and there is no minimum to clear.
Wiring a Simple Analytics Pipeline
A minimum useful setup has four moving parts and none of them is large:
1. Collect. A daily cron job pulls the last day of posts from each account you track.
2. Store. Write a row per post — the tweet id as the primary key so re-runs never double-count, plus the posted-at timestamp, the text, and the engagement counts. PostgreSQL or DuckDB is plenty; it stays a small table even after months of collection.
3. Compute. After a week or two of history, compute a rolling engagement rate per account — weighted engagements over followers over post count — averaged across a trailing window so one viral post, or one dud, does not swing the number.
4. Surface. Rank accounts by engagement velocity and watch for anomalies — one tracked account suddenly climbing is a signal worth a human look. Point a dashboard (Metabase, Grafana, or a notebook) at the table.
The whole thing is one cron job, one table, and one dashboard, and the data runs $5–20/month at competitor-tracking scale. The code snippet below is the core collect-and-compute step for a single account.
Reading the Numbers — Common Mistakes
Three mistakes account for most bad analytics conclusions:
Tracking the wrong metric. Optimising for impressions optimises for an inflated, gameable number. Engagement rate is the metric that predicts real reach — and it should weight replies and reposts above likes.
Sampling too slowly against a fast conversation. Pull a tracked account only once a day and you miss the engagement-velocity curve entirely. Most posts collect the large majority of their engagement within the first few hours; a daily snapshot sees only the settled total, never the shape.
Confusing size with reach. A large follower count with low engagement reaches fewer real people than a small, highly engaged audience. Always read follower count and engagement rate together — never size alone.
Comparing raw counts across different-sized accounts. A 500-like post is excellent for a small account and mediocre for a huge one. That is the whole reason engagement rate exists — it makes the comparison fair.
import requests
API_KEY = "your_api_key"
HEADERS = {"X-API-Key": API_KEY}
def recent_tweets(username, max_count=100):
"""Page through an account's recent posts on the cursor."""
out, cursor = [], ""
while len(out) < max_count:
params = {"userName": username}
if cursor:
params["cursor"] = cursor
r = requests.get(
"https://api.twitterapi.io/twitter/user/last_tweets",
params=params,
headers=HEADERS,
timeout=30,
)
r.raise_for_status()
body = r.json()
out.extend(body["data"]["tweets"])
if not body["has_next_page"]:
break
cursor = body["next_cursor"]
return out[:max_count]
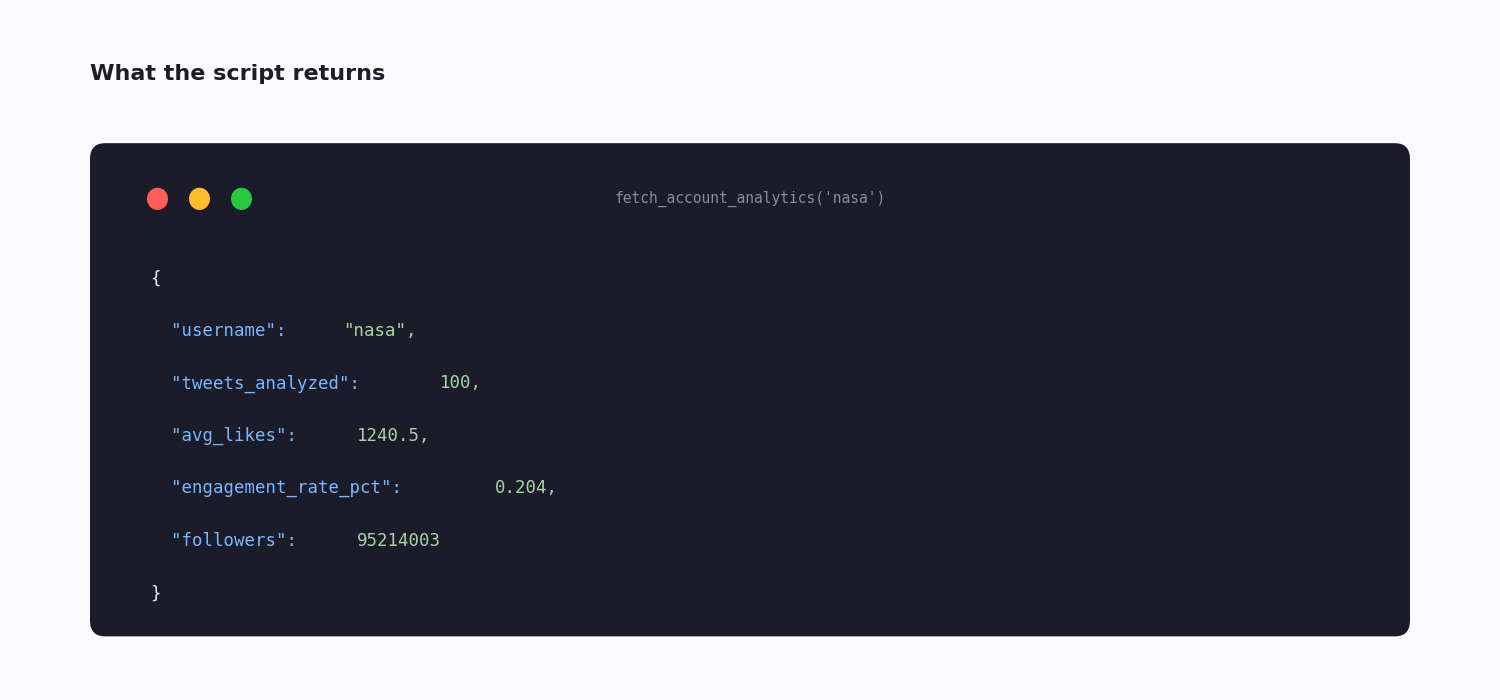
def fetch_account_analytics(username):
tweets = recent_tweets(username, max_count=100)
total_likes = sum(t["likeCount"] for t in tweets)
total_rts = sum(t["retweetCount"] for t in tweets)
total_replies = sum(t["replyCount"] for t in tweets)
profile = requests.get(
"https://api.twitterapi.io/twitter/user/info",
params={"userName": username},
headers=HEADERS,
timeout=30,
).json()["data"]
followers = profile["followers"]
# Weight replies and reposts above likes — they signal more.
weighted = total_likes + total_rts * 2 + total_replies * 3
rate = (weighted / followers / len(tweets) * 100) if followers and tweets else 0
return {
"username": username,
"tweets_analyzed": len(tweets),
"avg_likes": round(total_likes / len(tweets), 1) if tweets else 0,
"engagement_rate_pct": round(rate, 3),
"followers": followers,
}
print(fetch_account_analytics("nasa"))
Questions readers ask
Is Twitter analytics free?
For your own account, yes — the built-in dashboard in the analytics tab. Analytics on other accounts (competitors, hashtags, the wider conversation) needs API access, which is paid: a third-party API bills per call with no subscription, so you can start small and only pay for what you pull.
What's the most important Twitter analytics metric?
Engagement rate — weighted engagements divided by followers and post count. It normalises for audience size so accounts of different sizes can be compared fairly, and it tracks how far the algorithm carries a post. Impressions are inflated and gameable; raw follower count says nothing about whether an audience is active.
Can I track competitor Twitter accounts?
Not in the built-in dashboard — that shows only your own data, by design. Through the API you can pull any public account's posts, count their engagements, look up their follower count, and compute the same metrics for them that the dashboard computes for you. This is the most common reason teams need API-level analytics.
Can I get historical Twitter analytics beyond what the dashboard shows?
The built-in dashboard's history is shallow and drops older periods. Through the API you can collect and store posts yourself from the day you start, building a trend line of any length. Reaching far back into the past depends on your API provider's retention; the complete multi-year archive sits behind the official API's enterprise-level access.
How much does Twitter analytics tracking cost?
On a third-party pay-per-call API at about $0.15 per 1,000 tweets: a single account on a daily refresh is roughly $0.45/month, twenty competitor accounts about $9/month, and a busy campaign hashtag $20–50/month depending on volume. There is no subscription. The official X API can do the same but is metered per read, which is more expensive for read-heavy analytics.
Why is my engagement rate low even though impressions are high?
Because impressions and engagement measure different things. A post can be shown to many feeds (high impressions) while almost no one likes, replies or reposts (low engagement). High impressions with low engagement usually means the content reached people but did not resonate — and the algorithm reads that signal too, so impressions tend to fade without engagement behind them.
What's the difference between built-in analytics and API analytics?
The built-in dashboard is a free, no-setup view of your own account's recent performance. API analytics is a small pipeline you build that can compute the same metrics for any public account, export raw data, store unlimited history, and feed competitor benchmarking — at the cost of writing a little code and paying per call.
How often should I pull data for accurate analytics?
More often than once a day if you care about engagement velocity. Most posts collect the bulk of their engagement within the first few hours, so a daily snapshot only ever sees the settled total. Pulling every few hours captures the curve — how fast a post climbed — which is the more actionable signal.
Continue
- /
- /pricing
- /twitter-scraper
- /blog/twitter-api-cost
- /blog/free-twitter-analytics
- /blog/chart-data-twitter
- /is-twitter-api-free
Stop reading. Start building.
Starter credits cover real testing on real data. Google sign-in, no card, no application queue.
Get an API key