Build Real-Time Tweet Dashboards with Twitter API
Build Real-Time Tweet Dashboards with Twitter API
Want to analyze tweets in real time without the hassle of Twitter's official API? With TwitterAPI.io, you can skip rate limits, approval delays, and high costs. This guide shows you how to create a live tweet dashboard in just a few hours.
Key Takeaways:
- Real-time data: Use WebSocket streams to monitor live tweets instantly.
- Affordable pricing: Pay $0.15 per 1,000 tweets, with $1 in free credits for new users.
- Easy setup: No complex OAuth - just an API key for authentication.
- Tools needed: Python,
requests,websocket-client, and visualization frameworks like Streamlit or Dash. - Dashboard features: Track trends, sentiment, and user engagement with minimal delay.
Steps in Brief:
- Sign up on TwitterAPI.io: Get instant API access and free credits.
- Connect via WebSocket: Stream tweets live or fetch historical data with REST endpoints.
- Process data: Clean, filter, and analyze tweets using Python libraries like
pandas. - Visualize insights: Build interactive dashboards with Streamlit or Plotly Dash.
- Deploy & monitor: Host on platforms like Heroku or AWS for reliable performance.
This approach saves time, reduces costs, and simplifies the process of tracking live Twitter trends for research, marketing, or reporting.
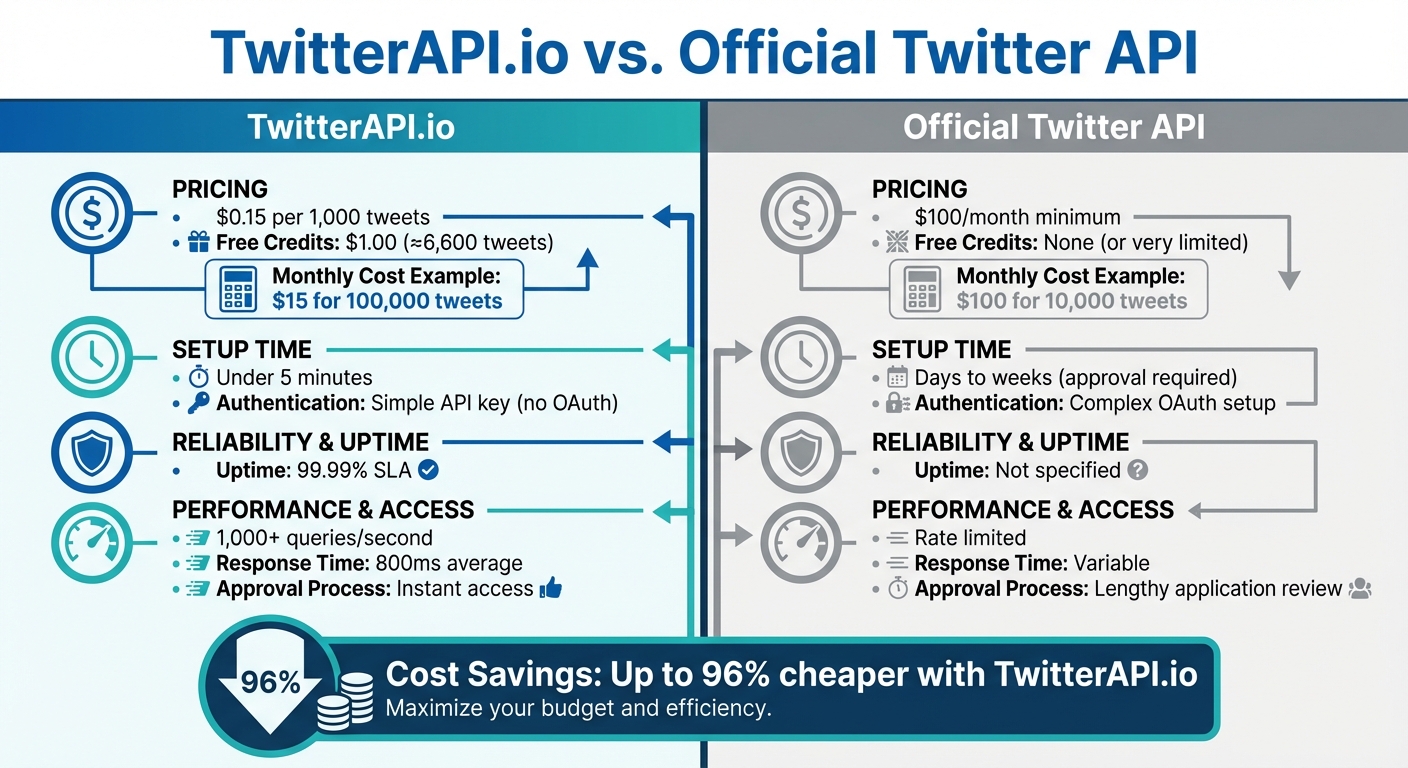
TwitterAPI.io vs Official Twitter API: Cost and Performance Comparison
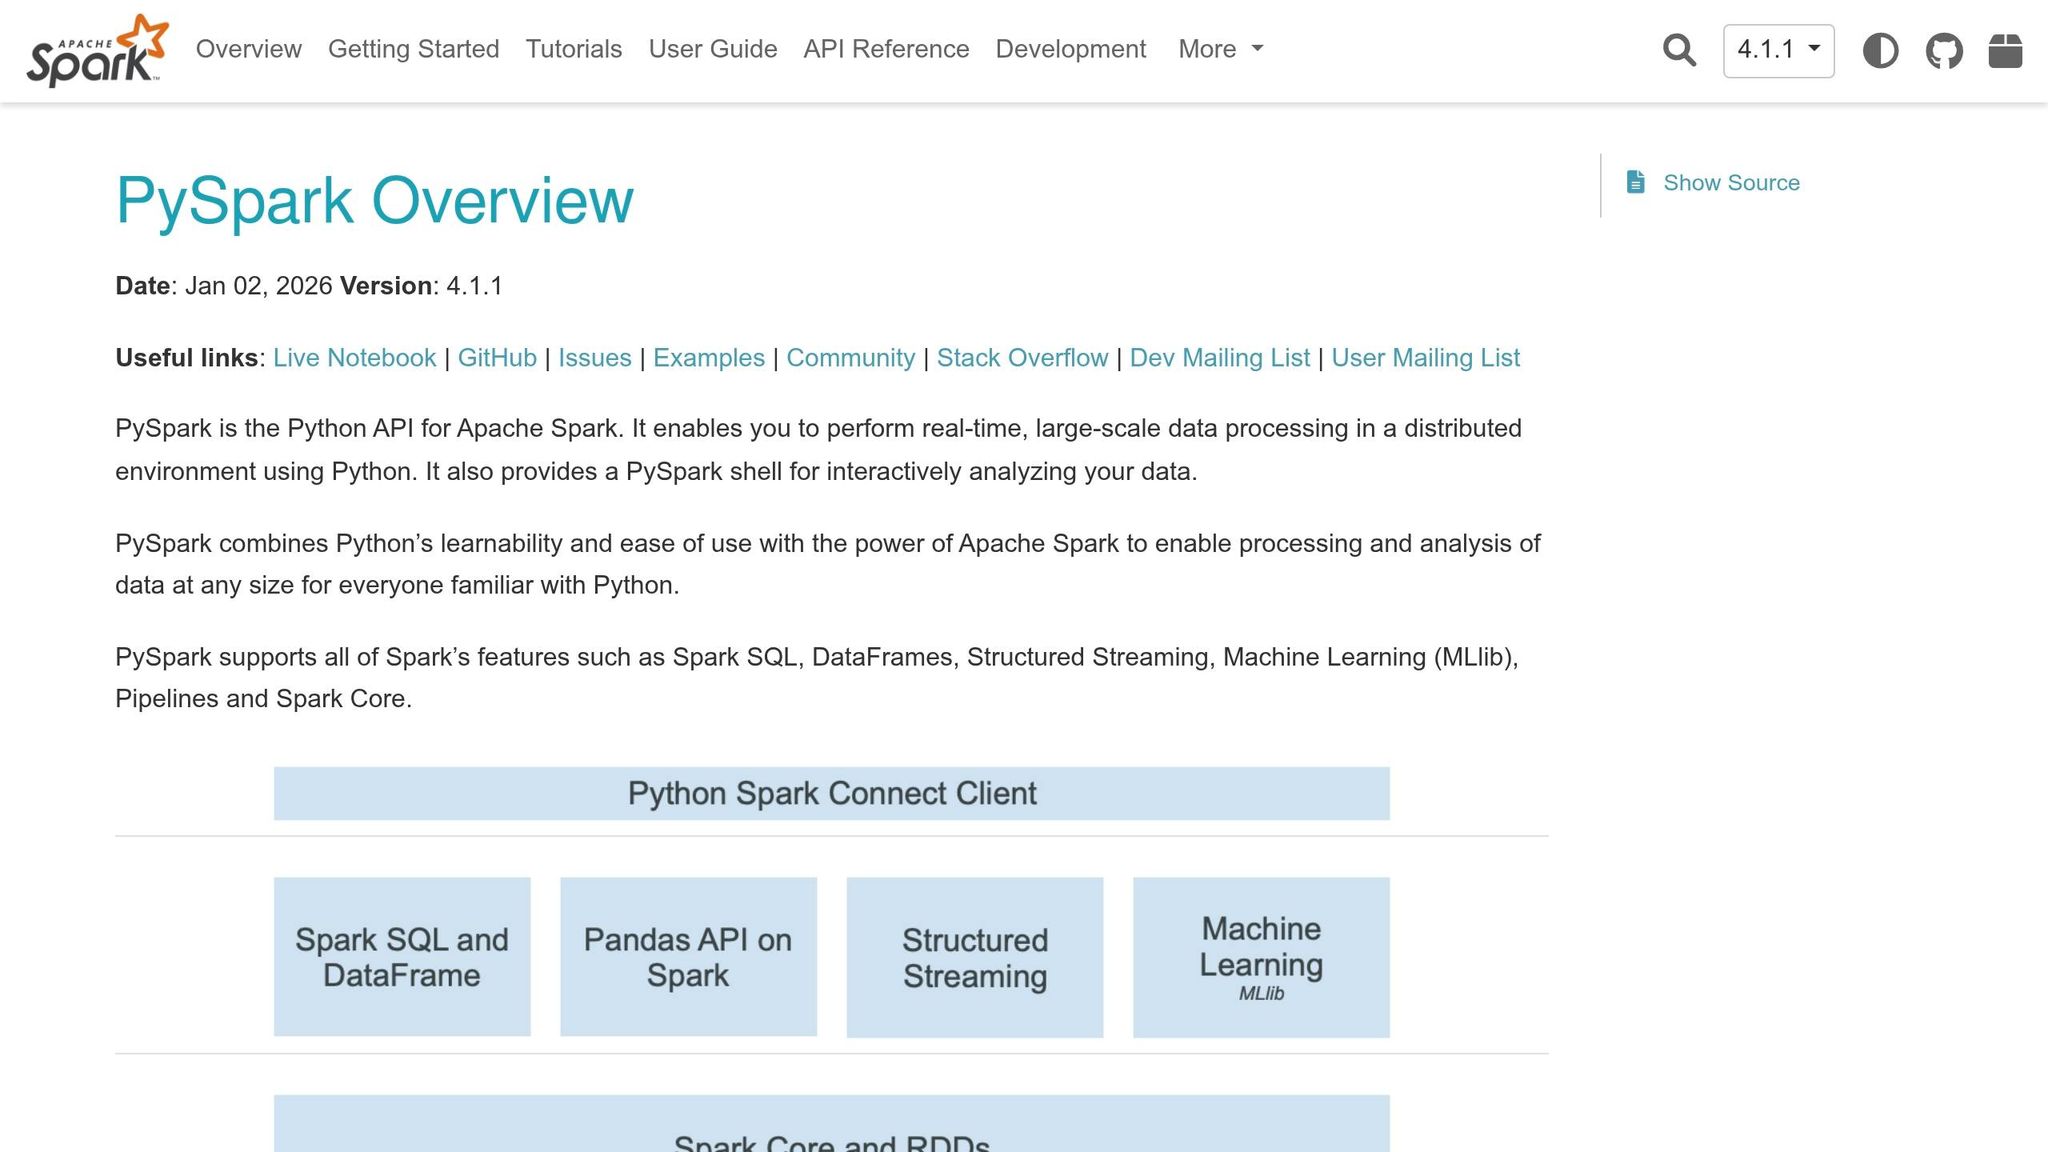
Real-Time X (Twitter) Sentiment Dashboard with PySpark + Streamlit | Spark
sbb-itb-9cf686c
What You Need Before Starting
To build your first real-time tweet dashboard, you'll need to gather a few essential tools and set up the right accounts. Thanks to TwitterAPI.io, you can get started quickly and have your dashboard operational in just a few hours.
Required Tools and Accounts
Here’s what you’ll need to get started:
- TwitterAPI.io account: Head over to TwitterAPI.io and sign up. You’ll receive $1 in free credits - enough to retrieve around 6,600 tweets and test the service. The platform simplifies the process by skipping complex OAuth authentication, making it ideal for rapid prototyping.
-
Python 3.7 or higher: Make sure Python is installed on your local machine. You’ll also need the
requestslibrary for making REST API calls and, optionally, thewebsocket-clientlibrary for real-time WebSocket streams. Install these with the following command:pip install requests websocket-client - Visualization tools: To create your interactive dashboard, use Streamlit or Dash. Both are Python-friendly frameworks that simplify the process of building dynamic dashboards.
Once you’ve got these tools and accounts set up, you’ll be ready to configure TwitterAPI.io and start pulling in real-time data streams.
How TwitterAPI.io Works
TwitterAPI.io acts as a powerful gateway that provides real-time access to Twitter data. It offers two types of endpoints: REST endpoints for on-demand queries and WebSocket endpoints for live, continuous streams. This dual approach gives you the flexibility to tailor your dashboard to your specific needs.
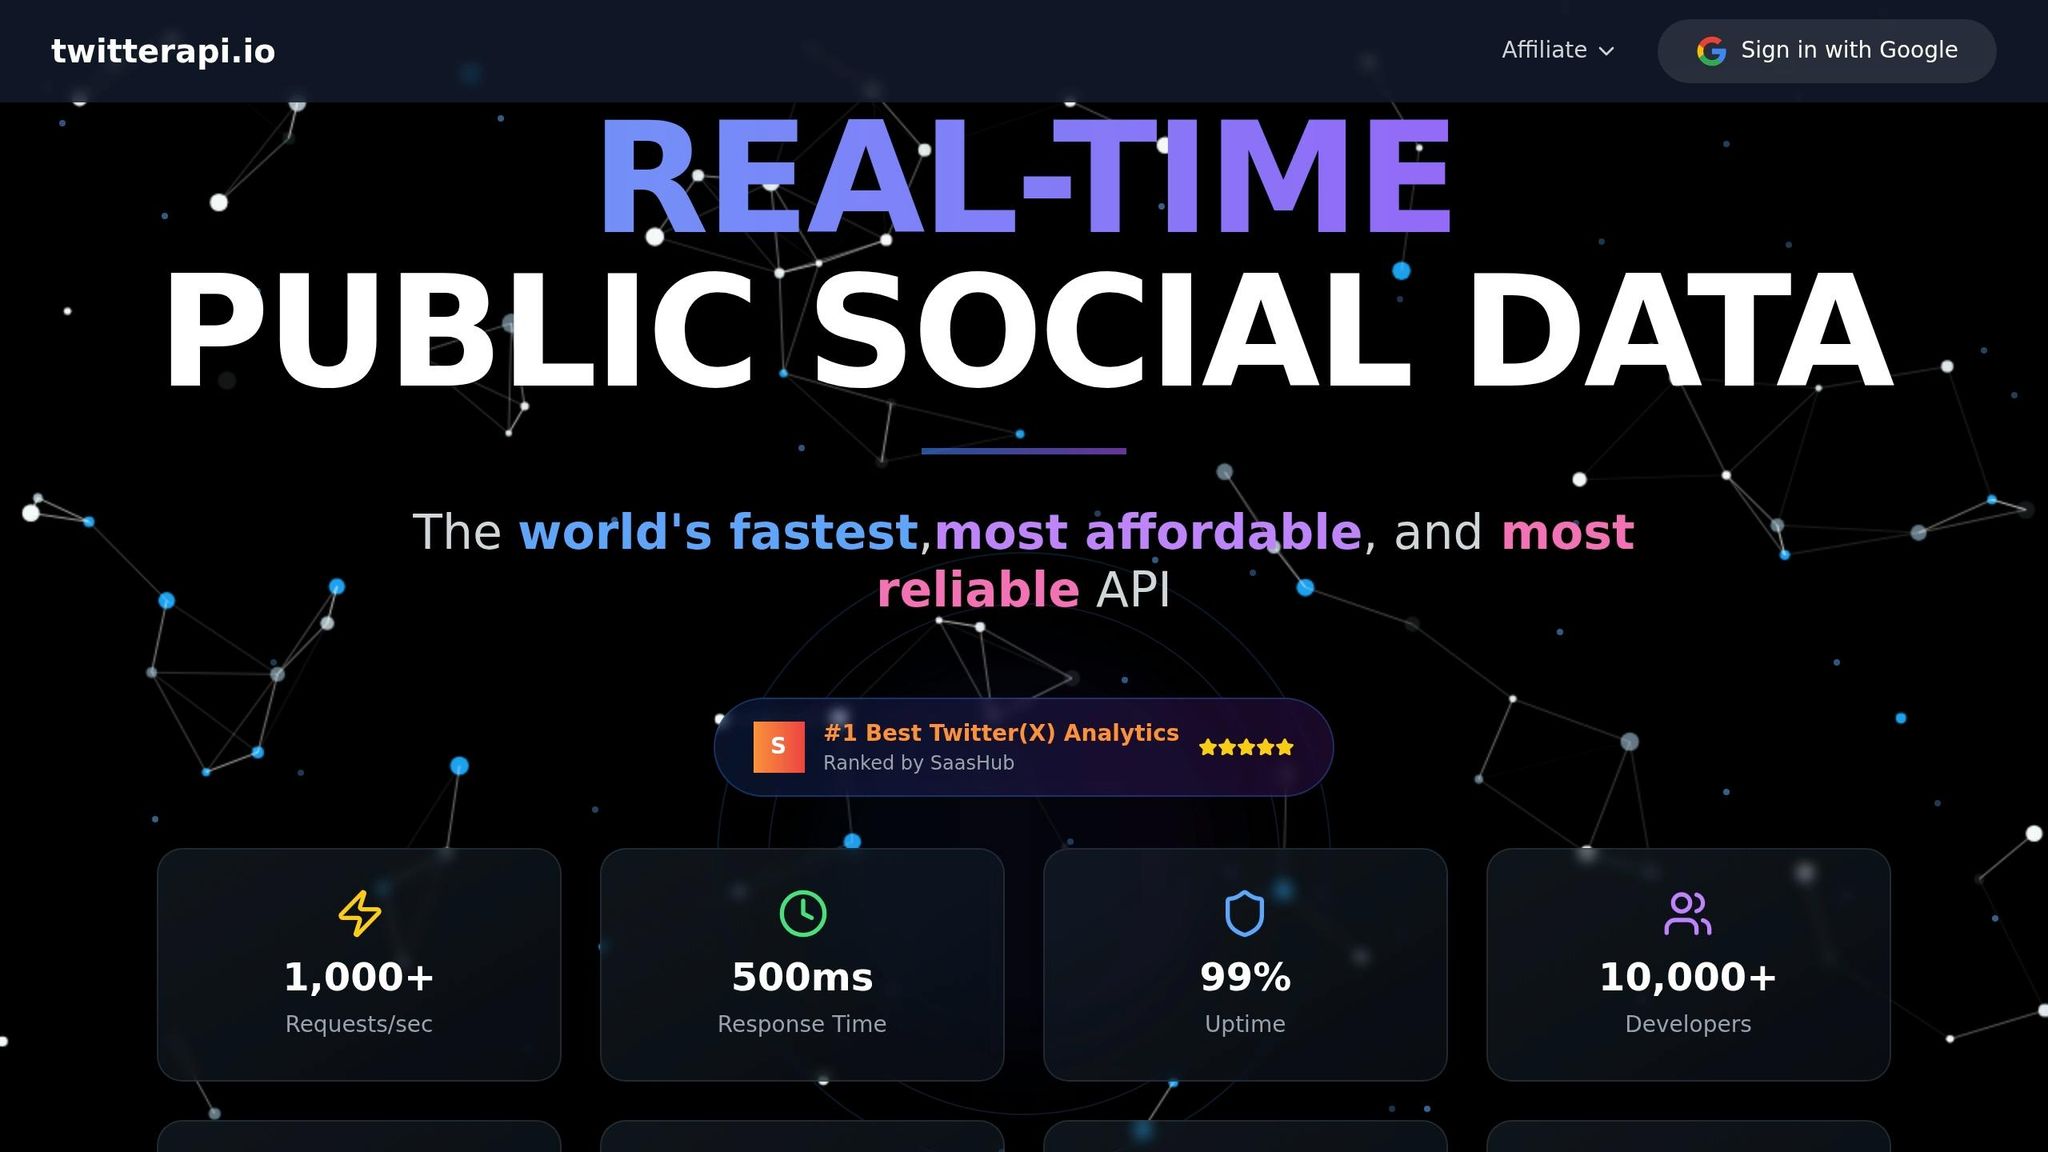
The platform is built on a global infrastructure with high availability, supporting over 1,000 queries per second (QPS). Whether you’re tracking breaking news, trending hashtags, or real-time sentiment changes, TwitterAPI.io ensures your dashboard stays up-to-date with the latest information - right as it happens.
Step 1: Set Up TwitterAPI.io for Real-Time Streams
Create an Account and Generate API Credentials
Getting started with TwitterAPI.io is incredibly quick - you're up and running in under 5 minutes. Head over to TwitterAPI.io and create a free account. No credit card is required, and you'll instantly receive $1.00 in free usage, so there's no waiting around to get started.
Once you log in, your API key will be prominently displayed on the Dashboard homepage. This is the only key you’ll need for authentication - no juggling multiple credentials or dealing with complicated OAuth setups. Make sure to copy and securely store your key, as it will be used in the x-api-key header for all API requests, including WebSocket connections.
Alex Chen, an AI Researcher at Stanford, shared: "TwitterAPI.io saved us months of development time. The data quality and speed are unmatched."
This simple setup means you can skip the lengthy approval process of official APIs and start streaming data almost immediately.
Once you’ve got your API credentials, it’s time to test your WebSocket connection.
Test the WebSocket Connection
To test your WebSocket connection, take advantage of the Swagger documentation provided on the TwitterAPI.io platform. The WebSocket endpoint for real-time streams is wss://ws.twitterapi.io/twitter/tweet/websocket. Before connecting, you’ll need to set up filter rules to specify the tweets you want to stream. For instance, you can filter by hashtags like #AI or focus on tweets from specific accounts using Twitter advanced search rules like from:elonmusk.
You can configure these filter rules directly through the TwitterAPI.io web interface. Once set, use the Swagger docs to initiate a test connection. Include your API key in the x-api-key header, and you’ll start receiving tweets that match your filters in real time. The platform is highly reliable, offering a 99.99% uptime SLA and an average response time of 800ms, while handling over 1,000 queries per second.
This testing phase ensures your credentials are valid and that your filters are correctly tuned before you dive into building your dashboard application. With a successful connection, you're ready to move on to fetching and processing tweet data.
Step 2: Fetch and Process Real-Time Tweet Data
Retrieve Tweet Data
Once your connection is up and running, it’s time to start pulling in tweet data. To get the best of both worlds - real-time updates and historical context - you’ll need to use a mix of WebSocket streams and REST APIs. This combination ensures your dashboard stays responsive while also offering valuable trend insights.
For live updates, set up a persistent WebSocket connection using the websocket-client library. First, install it with pip, then connect to wss://ws.twitterapi.io/twitter/tweet/websocket. With this setup, you can handle incoming JSON payloads that include key details like tweet ID, text, author, and timestamp.
For historical data, the /twitter/tweet/advanced_search REST endpoint is your primary tool. Use the requests library to fetch past tweets based on specific queries, date ranges (formatted as MM/DD/YYYY), and pagination. Here’s an example of a typical call:
requests.get(
    "https://api.twitterapi.io/twitter/tweet/advanced_search",
    params={"query": "python dashboard", "max_results": 100},
    headers={"x-api-key": "YOUR_KEY"}
)
The response includes a next_cursor field, which you can use to loop through pages until has_next_page returns False. This ensures you gather a complete dataset for your dashboard.
With both real-time and historical data streams in place, you’re ready to process and refine the information for meaningful insights.
Process and Filter Tweets
Now that you’ve gathered the data, it’s time to clean it up and make it useful. Start by parsing the JSON responses to extract the most relevant fields. Focus on:
data.textfor the tweet contentdata.public_metricsfor engagement stats like likes, retweets, and repliesincludes.users.public_metricsfor author details such as follower count and verification status
To make timestamps more readable, convert the created_at field into US date/time format using Python’s datetime module:
datetime.strptime(tweet['created_at'], '%Y-%m-%dT%H:%M:%S.%fZ').strftime('%m/%d/%Y %I:%M %p')
Next, clean and filter the data. Use pandas to handle tasks like removing duplicate tweets, filling in missing text fields, and normalizing content by converting it to lowercase and stripping URLs. To ensure relevance, filter tweets to include only those with more than 50 likes. If possible, configure server-side rules in the TwitterAPI.io dashboard to reduce the volume of data sent to your application. For example, use query="python lang:en" to exclude non-English tweets.
Keep an eye on rate limits by monitoring the x-rate-limit-remaining header in REST responses. If you hit a 429 error, implement exponential backoff to avoid disruptions. Finally, format numbers with thousand separators for better readability:
"{:,}".format(like_count)
Step 3: Visualize Data with Dashboard Tools
Choose a Visualization Tool
To turn your raw tweet data into interactive visuals, you’ll need the right tool. Two standout options are Streamlit and Plotly Dash.
Streamlit is perfect for rapid prototyping and quick demos. It uses a linear-flow execution model, allowing you to create interactive web apps with minimal effort - sometimes in just a few dozen lines of code. However, it re-runs the entire script with every user interaction, which can lead to higher latency. This makes it best suited for proof-of-concept projects or internal tools where fast iteration matters most.
Plotly Dash, on the other hand, is better for production-grade dashboards. Built on Flask, it uses an event-based callback system to refresh only the components that need updating, ensuring low latency even with high tweet volumes. Dash also offers extensive customization through CSS and JavaScript, making it ideal for complex, customer-facing applications. The open-source version is MIT-licensed, while the Enterprise edition includes features like authentication.
| Feature | Streamlit | Plotly Dash |
|---|---|---|
| Execution Model | Linear-flow (imperative) | Event-based (callbacks) |
| Simplicity | High | Moderate (requires UI logic) |
| Flexibility | Limited (standard widgets) | High (CSS/JS customization) |
| Latency | Higher (re-runs script) | Lower (targeted updates) |
| Ideal For | Rapid prototyping, demos | Production-grade, complex UIs |
If you’re already working in Jupyter notebooks, Voila can transform them into standalone web apps without major changes. For specialized visualizations, such as geospatial data, tools like Panel (HoloViz) might be a better fit.
After choosing your visualization tool, the next step is to integrate your data streams to power dynamic, real-time dashboards.
Connect to Data Pipelines
Once your tweet data is processed, it’s essential to separate data ingestion from visualization to maintain real-time updates. A good approach is routing your WebSocket stream to a memory cache, like Redis. From there, you can poll the cache at regular intervals (e.g., using Dash’s dcc.Interval) to keep your dashboard updated in real time. Thanks to TwitterAPI.io’s high query capacity, you can ensure a seamless data flow.
For historical analysis or batch processing, direct REST API responses from endpoints like /twitter/tweet/advanced_search into a cloud data warehouse. This builds on the earlier data setup for structured storage and analysis.
If you’re working with a React-based interface, tools like v0.dev make it easy to generate production-ready UI components. Pairing this with Cloudflare Pages offers free and reliable hosting for your dashboard.
Step 4: Build the Real-Time Tweet Dashboard
Create a Streamlit or Dash Application
With your data pipeline ready, the next step is creating an interactive dashboard using Streamlit or Dash.
For a Streamlit dashboard, write a Python script that retrieves data from your Redis cache. Use the @st.cache decorator to optimize performance by caching resource-intensive tasks like sentiment analysis or data aggregation. This prevents redundant calculations when refreshing the dashboard. Your dashboard should feature:
- A summary table with metrics like total tweets and keyword ratios.
- Line charts to track tweet volume trends.
- Word clouds to highlight hashtag usage.
To enhance interactivity, include sidebar widgets such as dropdowns for filtering keywords, date pickers for selecting timeframes, and refresh buttons. Additionally, configure a time-to-live (TTL) parameter for the cache to ensure periodic updates.
For Dash, take advantage of its callback system to build a dynamic and responsive interface. Your dashboard can showcase key elements like:
- Influential tweets sorted by follower count.
- Live feeds of recent tweets.
- Hourly or daily volume metrics.
- Sentiment trend lines.
To focus on meaningful insights, filter out tweets with a sentiment score of zero. Both Streamlit and Dash work seamlessly with Plotly, enabling you to create interactive visualizations that update in real-time as new data streams in via TwitterAPI.io’s WebSocket, which supports over 1,000 requests per second.
Once your dashboard is functional, the next step is to incorporate automation and alert systems for real-time monitoring.
Add Automation and Alerts
To keep your dashboard relevant and timely, set up automated updates and alert mechanisms.
Automated Refreshes
Determine refresh intervals based on your specific needs. For situations like breaking news or crisis management, set updates every 1–5 minutes to capture trends quickly without overloading API calls. If you're tracking brand mentions, a 15–30 minute interval is sufficient, resulting in approximately 1,440–2,880 API calls per month. For broader industry tracking, updates every 1–2 hours (360–720 calls monthly) should suffice.
Anomaly Detection
Set up triggers for unusual activity. For instance, if tweet volume surges by 200% within 10 minutes or if negative sentiment exceeds 60% in a 15-minute window, send immediate notifications. A practical way to detect anomalies is by calculating the rolling average of tweet volume over the past hour and flagging any data points that exceed two standard deviations from this average.
Notification Integration
In Streamlit, you can send email alerts using Python’s smtplib library or configure webhook notifications for platforms like Discord or Slack. For Dash, use callbacks to evaluate conditions during each update and trigger alerts when thresholds are met. This ensures you’re instantly informed about trending topics, viral mentions, or potential PR issues without needing to monitor the dashboard constantly.
Step 5: Deploy and Monitor the Dashboard
Host the Dashboard
To make your dashboard accessible to users, you'll need to host it on a reliable platform. For small-scale prototypes or projects with low traffic, Streamlit's free Community Cloud tier is a straightforward option. However, if you're working with production-level environments that involve high-volume tweet streams, platforms like Heroku or AWS are better suited for their reliability and ability to scale.
Heroku offers an easy way to deploy your application using its container-based infrastructure. Here's a quick breakdown of the process:
- Create a
Procfileto define your app's entry point. - List all Python dependencies in a
requirements.txtfile. - Push your code to Heroku's Git repository.
Once deployed, Heroku automatically adjusts resources (known as dynos) based on traffic, ensuring smooth performance.
For more demanding enterprise-level deployments, AWS provides robust tools for scalable processing. For instance:
- Use AWS EMR (Elastic MapReduce) to run Spark in cluster mode, enabling parallel processing of massive data volumes.
- If you're using Amazon Kinesis Data Streams for ingesting tweets, you can fine-tune the number of shards to handle varying tweet volumes. Kinesis retains records for 24 hours by default, but this can be extended up to 365 days for historical analysis.
- Pair Kinesis with Amazon Athena for serverless SQL queries, and use bootstrap scripts on AWS EMR to install necessary packages.
Once your dashboard is live, make sure to monitor its performance regularly to ensure it stays responsive and efficient.
Monitor and Optimize Performance
With hosting in place, the next step is to keep a close eye on how your dashboard performs. Track key metrics like query latency, memory consumption, and API call frequency. For example, Spark Structured Streaming can achieve latencies as low as 100 milliseconds, but maintaining this requires efficient data handling. Also, pay attention to WebSocket closure codes - code 1000 indicates a normal shutdown, while other codes might signal issues that need fixing.
If you're working on an academic project, consider submitting your .edu email and project description to access potential discounts on certain tools or platforms.
For long-term use, plan to retrain your machine learning models regularly - monthly retraining is a good benchmark. This ensures your models stay accurate by adapting to changing tweet trends and prevents data drift. Additionally, tools like AWS QuickSight can be integrated with Athena to provide real-time visual updates. You can even schedule automatic data refreshes to keep your insights up to date.
Conclusion
You've now walked through every step to get your dashboard up and running, from setting up your TwitterAPI.io account to deploying and monitoring live tweet streams. With this guide, you’re equipped to track and analyze tweets in real time without breaking a sweat.
At just $0.15 per 1,000 tweets, TwitterAPI.io offers a cost-effective, pay-as-you-go model. Compared to the official Twitter API pricing, which starts at $100 per month for 10,000 tweets, this approach saves you up to 96% on costs. Plus, new users get $1 in free credits upon signing up - no monthly fees, no hidden charges.
With a 99.99% uptime guarantee, the ability to handle over 1,000 queries per second, and an average response time of 800ms, TwitterAPI.io ensures your dashboard remains reliable and responsive, even during peak traffic events.
Take it a step further by enabling write actions. This upgrade transforms your dashboard from a passive monitoring tool into an active social media management system. Automate replies, post updates, or even quote tweets - all directly from your dashboard. If you're working on academic research, submitting your .edu email and project description unlocks special discounts tailored for educational purposes.
Your dashboard is now a powerful tool for tracking brand mentions, analyzing sentiment, and staying on top of trending topics. Use these insights to make informed decisions and drive impactful actions.
FAQs
How do I handle reconnects if a WebSocket drops?
To manage WebSocket reconnects effectively, you’ll need a strategy that includes retrying connections after a short delay - say, 10 seconds. Start by creating a function to initialize the WebSocket. This function should handle setting up event listeners for key events like onopen, onmessage, and onclose.
When the connection closes or encounters an error, use setTimeout() to delay the reconnection attempt. During this process, reinitialize the WebSocket and ensure any necessary messages - like authentication tokens or subscription requests - are resent to maintain functionality.
If all of this sounds like a lot of work, you can also consider using libraries that come with built-in reconnection features. These tools can save time and reduce complexity while ensuring a smoother reconnection process.
What’s the best way to store and query tweets for longer-term analysis?
The most effective way to handle Twitter data is by creating a data pipeline that imports it into a database or data warehouse. Here's how it works: you can use Python to connect to platforms like TwitterAPI.io, which allows you to pull in data such as tweets and user profiles. Once retrieved, this data can be stored in a database like DuckDB.
This approach offers several benefits: it ensures your data is stored efficiently, adapts to changes in the schema, and is easy to query - making it ideal for long-term analysis.
How can I secure my API key when deploying the dashboard?
To keep your API key safe, treat it like a password - keep it private and never expose it in client-side code. The best practice is to store your keys in server-side environment variables, ensuring they stay hidden from the frontend. If you're deploying on cloud platforms, take advantage of secret management tools or environment-specific configurations to secure them. Also, avoid committing your keys to version control systems like Git. Instead, load them dynamically at runtime within your backend logic to maintain security.
Tags
Related articles
Ready to get started?
Try TwitterAPI.io for free and access powerful Twitter data APIs.
Get Started Free