Twitter Analytics Report Template: 9 Sections, Filled In From the API
Most social media report templates are slide decks with empty boxes labeled "Impressions" and "Engagement". They tell you what to put in a report but not where the number comes from, how it's defined, or how to get it without copying figures by hand from a dashboard every month. That's the gap this page fills for Twitter (X) specifically.
Below you'll find the template itself (nine sections, each with the question it answers), a field-by-field map from every metric to the API response that supplies it, a runnable Python script that produces the finished report for your account and your competitors, and the monthly cost of automating it compared with the official X API. If you need engagement-rate math in more depth, or a one-off profile lookup rather than a recurring report, the sibling guides linked at the bottom cover those.
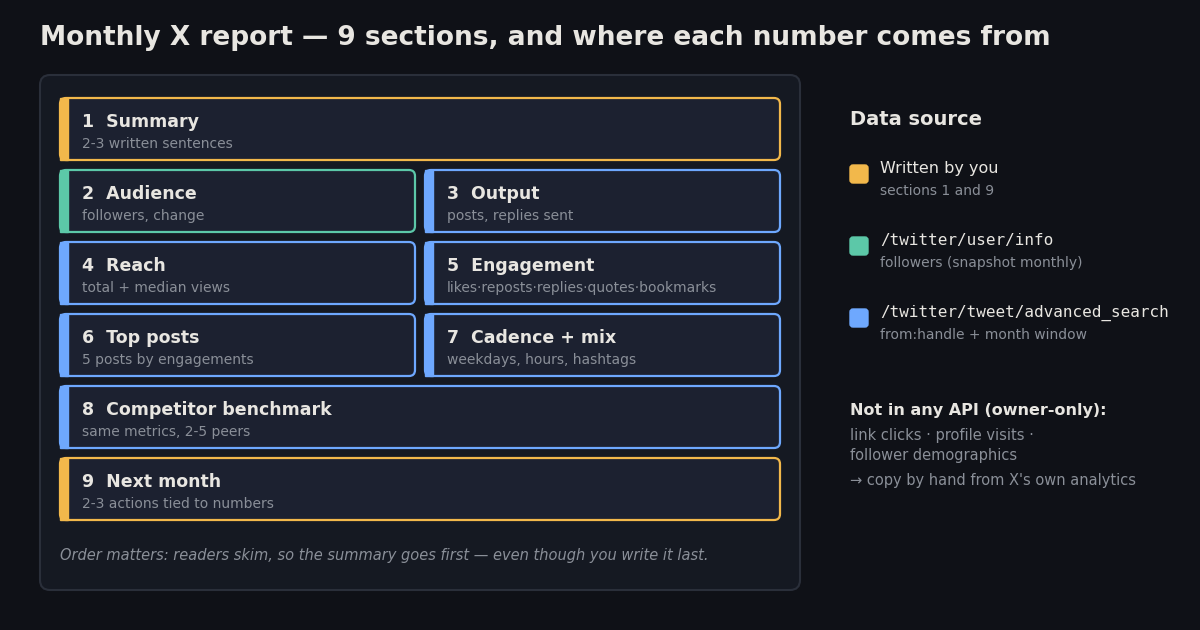
The template: 9 sections of a monthly X report
Each section answers one question a manager or client actually asks. Keep the order: people read the summary and skim the rest, so the summary goes first even though you write it last.
Two design choices matter more than the layout. Use the median views per post alongside the total, because one viral post can carry a month's total and hide that most posts underperformed. And compute engagement rate against views, not followers, so a 5,000-follower account and a 500,000-follower account land on the same scale in the benchmark table.
Where every number comes from (field map)
This is the part most templates skip. Every metric in sections 2-8 comes from two TwitterAPI.io endpoints, and all of the fields are on public accounts, so the same code works for your account and for competitors.
What the API can't give you: link clicks, profile visits, and follower demographics. Those are private to the account owner and only appear in X's own analytics for that account. If your report needs them, add them by hand from that dashboard; everything else can be automated. Field names above are taken from the TwitterAPI.io OpenAPI spec (docs.twitterapi.io).
Step 1: pull one month of posts
Use the advanced search endpoint with the from: operator and a calendar-month window. Per the TwitterAPI.io docs, date bounds go in as unix timestamps with since_time: and until_time:. Results come back newest-first in pages with has_next_page and next_cursor. Reposts of other people's posts are filtered out (they carry a retweeted_tweet object), because their likes and views belong to the original author, not to you.
# Step 1: one calendar month of an account's posts (reposts dropped)
import os, requests
from datetime import datetime, timezone

HEADERS = {"X-API-Key": os.environ["TWITTERAPI_IO_KEY"]}

def month_bounds(y, m):
    lo = datetime(y, m, 1, tzinfo=timezone.utc)
    hi = datetime(y + (m == 12), m % 12 + 1, 1, tzinfo=timezone.utc)
    return int(lo.timestamp()), int(hi.timestamp())

lo, hi = month_bounds(2026, 9)
query = f"from:nasa since_time:{lo} until_time:{hi}"
cursor, posts = "", []
while True:
    r = requests.get(
        "https://api.twitterapi.io/twitter/tweet/advanced_search",
        headers=HEADERS,
        params={"query": query, "queryType": "Latest", "cursor": cursor},
        timeout=20,
    )
    r.raise_for_status()
    body = r.json()
    posts += [t for t in body.get("tweets", []) if not t.get("retweeted_tweet")]
    if not body.get("has_next_page"):
        break
    cursor = body["next_cursor"]
print(len(posts), "posts in the month")Step 2: compute sections 3 to 6
Engagements per post are likes + reposts + replies + quotes. Bookmarks are reported separately because they're private saves rather than visible reactions; add them to the numerator if your team prefers, but do it the same way every month. Engagement rate by views is total engagements divided by total views for the month.
Posts with zero views are kept in the median on purpose: if part of your output reached nobody, the report should show it.
# Step 2: the numbers for sections 3-5 of the template
import statistics

def engagements(t):
    return sum(t.get(k) or 0 for k in ("likeCount", "retweetCount", "replyCount", "quoteCount"))

views = [t.get("viewCount") or 0 for t in posts]
originals = [t for t in posts if not t.get("isReply")]
total_eng = sum(engagements(t) for t in posts)

print("posts:", len(originals), "| replies sent:", len(posts) - len(originals))
print("views:", sum(views), "| median per post:", int(statistics.median(views)) if views else 0)
print("engagement rate by views:", round(100 * total_eng / sum(views), 2) if sum(views) else None, "%")
for t in sorted(posts, key=engagements, reverse=True)[:5]:
print(engagements(t), t.get("url"))Follower growth: snapshot it, because you can't backfill it
/twitter/user/info returns today's follower count. There's no field for what the count was on the 1st of last month, so "followers gained this month" only works if you recorded last month's number. The full script below appends the count to followers_<handle>.csv every time it runs and reports the difference from the previous row. The first run prints "first snapshot"; from the second month on, you get a real delta.
Run the report on the same day each month (the 2nd or 3rd works well) so the gap between snapshots stays consistent. If you need a follower trend before you started snapshotting, the historical follower count guide linked below covers what's recoverable.
Cost of automating the report: TwitterAPI.io vs the official X API
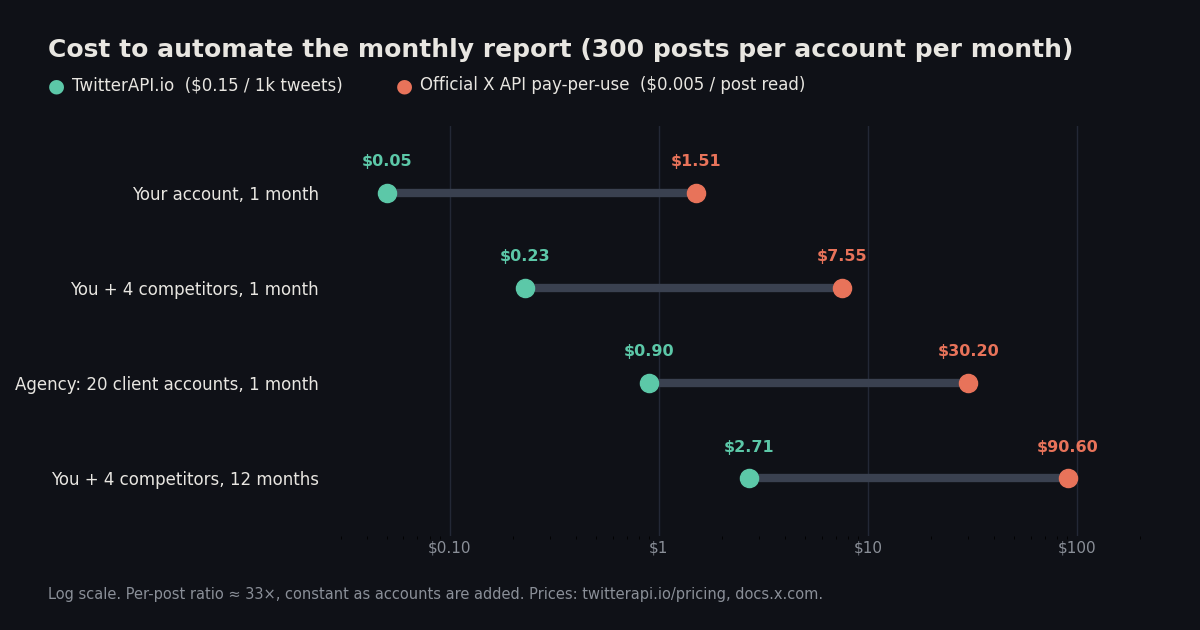
Each report reads every post in the month once, plus one profile per account. Prices: twitterapi.io/pricing lists $0.15 per 1,000 tweets and $0.18 per 1,000 profiles, with a $0.00015 minimum per call. docs.x.com pay-per-use pricing lists $0.005 per post read and $0.010 per user read. The post volume below (300 per account per month) is an example input; scale it to your accounts.
The per-post ratio is $0.005 ÷ $0.00015 ≈ 33×, and that ratio holds as you add accounts. In practice the cost of the data is small either way for a single brand; it matters for agencies and for anyone benchmarking many competitors every month.
Report hygiene: four mistakes that make month-over-month numbers lie
Pulling too early. Likes and views keep accruing after a post goes out, so a post from the 30th looks weaker than a post from the 2nd if you pull on the 1st. Pick a fixed pull day a few days after month-end and keep it.
Mixing in reposts. A repost of a viral post can show huge view counts that aren't yours. Drop posts with retweeted_tweet, as the code above does.
Reporting in UTC by accident. createdAt is UTC. If your audience is in New York or Tokyo, convert before you bucket by hour, or the "best time to post" row will be off by several hours.
Comparing averages across accounts. A competitor with one outlier post will look stronger on mean views. Compare median views and engagement rate by views in section 8.
# Monthly Twitter (X) analytics report: fills the 9-section template for one
# account plus competitors, writes report_<handle>_<YYYY-MM>.md and a per-post CSV
import os, csv, statistics, requests
from collections import Counter
from datetime import datetime, timezone

API = "https://api.twitterapi.io"
HEADERS = {"X-API-Key": os.environ["TWITTERAPI_IO_KEY"]}
HANDLE = "nasa"
COMPETITORS = ["esa", "spacex"]
YEAR, MONTH = 2026, 9

def get(path, **params):
    r = requests.get(API + path, headers=HEADERS, params=params, timeout=20)
    r.raise_for_status()
    return r.json()

def month_bounds(y, m):
    lo = datetime(y, m, 1, tzinfo=timezone.utc)
    hi = datetime(y + (m == 12), m % 12 + 1, 1, tzinfo=timezone.utc)
    return int(lo.timestamp()), int(hi.timestamp())

def parse_ts(s):  # "Tue Dec 10 07:00:30 +0000 2024"
    return datetime.strptime(s, "%a %b %d %H:%M:%S %z %Y")

def engagements(t):
    return sum(t.get(k) or 0 for k in ("likeCount", "retweetCount", "replyCount", "quoteCount"))

def month_posts(handle, y, m):
    lo, hi = month_bounds(y, m)
    query = f"from:{handle} since_time:{lo} until_time:{hi}"
    cursor, out = "", []
    while True:
        body = get("/twitter/tweet/advanced_search", query=query, queryType="Latest", cursor=cursor)
        out += [t for t in body.get("tweets", []) if not t.get("retweeted_tweet")]
        if not body.get("has_next_page"):
            return out
        cursor = body["next_cursor"]

def follower_delta(handle, now):
    # user/info only returns today's count, so keep your own monthly snapshots
    path, prev = f"followers_{handle}.csv", None
    if os.path.exists(path):
        with open(path) as f:
            rows = list(csv.reader(f))
        prev = int(rows[-1][1]) if rows else None
    with open(path, "a", newline="") as f:
        csv.writer(f).writerow([datetime.now(timezone.utc).date().isoformat(), now])
    return None if prev is None else now - prev

def summarize(handle, y, m):
    profile = get("/twitter/user/info", userName=handle)["data"]
    tweets = month_posts(handle, y, m)
    views = [t.get("viewCount") or 0 for t in tweets]
    total_eng = sum(engagements(t) for t in tweets)
    return {
        "handle": handle,
        "followers": profile.get("followers") or 0,
        "posts": sum(1 for t in tweets if not t.get("isReply")),
        "replies_sent": sum(1 for t in tweets if t.get("isReply")),
        "views": sum(views),
        "median_views": int(statistics.median(views)) if views else 0,
        "likes": sum(t.get("likeCount") or 0 for t in tweets),
        "reposts": sum(t.get("retweetCount") or 0 for t in tweets),
        "replies": sum(t.get("replyCount") or 0 for t in tweets),
        "quotes": sum(t.get("quoteCount") or 0 for t in tweets),
        "bookmarks": sum(t.get("bookmarkCount") or 0 for t in tweets),
        "eng_rate": round(100 * total_eng / sum(views), 2) if sum(views) else None,
        "tweets": tweets,
    }

def top(counter, n=5):
    return ", ".join(f"{k} ({v})" for k, v in counter.most_common(n)) or "none"

def render(me, rivals, delta, y, m):
    tw = me["tweets"]
    best = sorted(tw, key=engagements, reverse=True)[:5]
    days = Counter(parse_ts(t["createdAt"]).strftime("%a") for t in tw)
    hours = Counter(f"{parse_ts(t['createdAt']).hour:02d}:00 UTC" for t in tw)
    ents = [t.get("entities") or {} for t in tw]
    tags = Counter("#" + h["text"].lower() for e in ents for h in e.get("hashtags") or [])
    ments = Counter("@" + u["screen_name"].lower() for e in ents for u in e.get("user_mentions") or [])
    clients = Counter(t.get("source") or "unknown" for t in tw)
    growth = "first snapshot" if delta is None else f"{delta:+,} since last snapshot"
    lines = [
        f"# X analytics report: @{me['handle']}, {y}-{m:02d}", "",
        "## 1. Summary", "_Write 2-3 sentences after reading sections 2-8._", "",
        "## 2. Audience", f"- Followers: {me['followers']:,} ({growth})", "",
        "## 3. Output", f"- Posts: {me['posts']}  |  Replies sent: {me['replies_sent']}", "",
        "## 4. Reach", f"- Views: {me['views']:,}  |  Median views per post: {me['median_views']:,}", "",
        "## 5. Engagement",
        f"- Likes {me['likes']:,} · Reposts {me['reposts']:,} · Replies {me['replies']:,} · "
        f"Quotes {me['quotes']:,} · Bookmarks {me['bookmarks']:,}",
        f"- Engagement rate by views: {me['eng_rate']}%", "",
        "## 6. Top 5 posts", *[f"- {engagements(t):,} engagements · {t.get('url')}" for t in best], "",
        "## 7. Cadence and content mix",
        f"- Busiest days: {top(days, 3)}", f"- Busiest hours: {top(hours, 3)}",
        f"- Hashtags: {top(tags)}", f"- Mentions: {top(ments)}", f"- Posting clients: {top(clients, 3)}", "",
        "## 8. Competitor benchmark",
        "| Account | Followers | Posts | Median views | Eng. rate (views) |", "| --- | --- | --- | --- | --- |",
        *[f"| @{r['handle']} | {r['followers']:,} | {r['posts']} | {r['median_views']:,} | {r['eng_rate']}% |"
          for r in [me, *rivals]], "",
        "## 9. Next month", "_Two or three actions, each tied to a number above._",
    ]
    return "\n".join(lines)

me = summarize(HANDLE, YEAR, MONTH)
rivals = [summarize(h, YEAR, MONTH) for h in COMPETITORS]
delta = follower_delta(HANDLE, me["followers"])
stem = f"report_{HANDLE}_{YEAR}-{MONTH:02d}"
with open(stem + ".md", "w") as f:
    f.write(render(me, rivals, delta, YEAR, MONTH))
with open(stem + ".csv", "w", newline="") as f:
    w = csv.writer(f)
    w.writerow(["id", "createdAt", "isReply", "views", "likes", "reposts", "replies", "quotes", "bookmarks", "url"])
    for t in me["tweets"]:
        w.writerow([t["id"], t["createdAt"], t.get("isReply"), t.get("viewCount"), t.get("likeCount"),
                    t.get("retweetCount"), t.get("replyCount"), t.get("quoteCount"), t.get("bookmarkCount"), t.get("url")])
n = len(me["tweets"]) + sum(len(r["tweets"]) for r in rivals)
print(f"wrote {stem}.md/.csv from {n} posts, approx cost ${n * 0.00015 + (1 + len(COMPETITORS)) * 0.00018:.3f}")
Questions readers ask
What should a Twitter analytics report include?
A summary, audience (followers and change), output (posts and replies), reach (views and median views per post), engagement (likes, reposts, replies, quotes, bookmarks, engagement rate), top posts, cadence and content mix, a competitor benchmark, and next month's actions.
How do I calculate engagement rate for a Twitter report?
Add likes, reposts, replies and quotes across the month's posts, divide by total views, and multiply by 100. Dividing by views rather than followers makes accounts of different sizes comparable.
Can I make a Twitter analytics report for a competitor's account?
Yes, for the public metrics. Views, likes, reposts, replies, quotes, bookmarks, hashtags, mentions and follower counts are all available for public accounts via the API. Link clicks, profile visits and audience demographics are private to the account owner.
How do I get last month's follower count?
The profile endpoint only returns the current count, so record it each time you run the report. The script on this page keeps a snapshot file and reports the change since the previous run.
How much does it cost to automate a monthly Twitter report?
For one account posting 300 times a month, about $0.05 on TwitterAPI.io ($0.15 per 1,000 posts plus one profile read) versus about $1.51 on the official X API's pay-per-use rates.
Can the report be exported to Excel or Google Sheets?
The script writes a per-post CSV next to the Markdown report. Open it in Excel or import it into Google Sheets to build charts or pivot tables.
Continue
- TwitterAPI.io docs — advanced_search query, since_time/until_time, cursor pagination
- TwitterAPI.io OpenAPI spec — Tweet fields (viewCount, bookmarkCount, entities, source, createdAt) and UserInfo.followers
- TwitterAPI.io pricing — $0.15 per 1K tweets, $0.18 per 1K profiles, $0.00015 minimum per call
- X Developer Platform — pay-per-use pricing ($0.005 per post read, $0.010 per user read)
- igorbrigadir/twitter-advanced-search — community reference for X search operators
- Twitter (X) analytics: free tools and API
- Twitter engagement rate calculator via API
- Twitter competitor analysis with the API
- Historical Twitter follower counts
- Twitter hashtag analytics API guide
- Twitter advanced search API guide
- Twitter (X) API — endpoint hub
- TwitterAPI.io pay-per-call pricing
Stop reading. Start building.
Starter credits cover real testing on real data. Google sign-in, no card, no application queue.
Get an API key