What Are Twitter (X) Impressions and How Are They Counted?
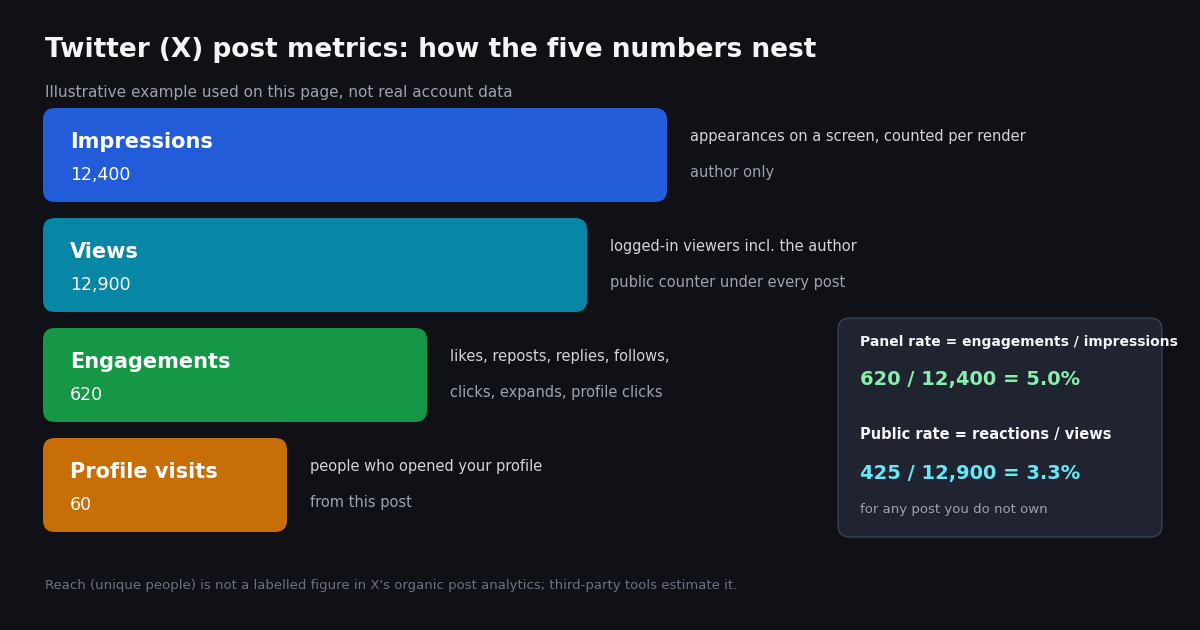
Open the analytics panel on any post you wrote and the first number you see is impressions. It is usually the biggest number on the panel, it moves fastest in the first hour, and it is the one most people misread, either as "people who saw this" or as the same thing as the views counter under the post. Neither is quite right.
This page explains what X actually counts as an impression, how that differs from views, reach, engagements, and profile visits, where each number lives in the app and on the web, and how to turn impressions into an engagement rate with a worked example. The last section is for anyone who wants the same arithmetic over hundreds of posts or over accounts they do not own, where the API is the practical route.
Two things are out of scope. Profile views (how many people opened your profile page) have their own page, and so does the question of whether X tells you who looked at your profile. Both are linked below.
What X counts as an impression
X's help page for the post activity dashboard gives the definition in one line: an impression is an appearance of a post on a user's screen, and the count is not unique, so the same person seeing a post twice produces two impressions (help.x.com, verified 2026). Every other property of the metric follows from that sentence.
It is counted per render, not per person. If a follower sees your post in Home on their phone, then again on their laptop, that is two impressions from one person. If your post is reposted and the same follower sees the repost, that is a third. This is why impressions are almost always the largest number on the analytics panel and why they are a poor stand-in for "how many people saw it".
It is counted wherever the post is rendered. The Home timeline is the big source, but search results, your profile page, a reply thread where your post is the parent, a quote post that embeds yours, and a notification that previews the post all render it and all count. Third-party guides we checked in 2026 list timeline, search, and profile as the usual sources, which matches X's own wording about appearances on screen.
It needs no action. Nobody has to pause, read, expand, or tap. A post that scrolls past at speed still registers. That is the whole point of the metric: it measures distribution, meaning how often X put the post in front of someone, not whether the post landed.
It is private to the author. Impressions appear only in the analytics for your own posts. There is no way to see another account's impressions through the app, and the public API fields do not include them either; what everyone can see is the views counter, which the next section covers.
Impressions vs views: why the number under the post is different
Every post on X shows a views count next to the likes and reposts. It looks like a public version of impressions, and in practice it is close, but X documents the two on separate help pages with separate definitions, and the numbers rarely match to the digit.
X's view-counts help page says that anyone who is logged in and views a post counts as a view, regardless of where they see it (Home, Search, Profiles) or whether they follow the author, that the author looking at their own post also counts, and that multiple views are counted if the same person views the post more than once, for example once on web and once on the phone (help.x.com, verified 2026). The same page notes that Community posts, X Circle posts, and older posts do not have view counts.
Set the two definitions side by side and the differences are small but real. Views explicitly include the author's own looks at the post; the activity dashboard does not say the same about impressions. Views are limited to logged-in viewers; the impression definition does not mention login state. Both count repeat appearances by the same person. Guides we checked in 2026 also report that for video posts, a view requires the video to play for a short minimum time with most of it on screen, which is a stricter bar than an impression; we could not confirm that threshold on X's help pages, so treat it as practitioner reporting.
The practical reading is this: impressions are the author-only distribution count from the analytics system, and views are the public approximation of the same thing from the counter system. When the two disagree by a few percent, that is expected, not a bug. When you need a number for someone else's post, views is the only one available, and it is the one the API returns as viewCount.
Impressions, views, reach, engagements, profile visits: side by side
The five words get used interchangeably in marketing decks, but X treats them as different things, shows them in different places, and only exposes some of them publicly. The table is the reference; the paragraphs after it cover the two that cause the most confusion.
Reach is the odd one out. Guides from analytics vendors define reach as the number of unique accounts that saw the post, so one person seeing it five times is five impressions but one reach, and they note that impressions are always greater than or equal to reach (social-analytics guides checked 2026, see sources). X's organic post analytics does not label a reach figure; where you see "reach" for X it is normally a third-party estimate or an ads-side metric. If someone quotes a reach number for an organic post, ask how it was derived.
Engagements are broader than most people assume. X counts clicks anywhere on the post, including expanding it to read the detail view, as an engagement (help.x.com, verified 2026). That is why the engagement total on the analytics panel is usually far higher than likes plus reposts plus replies, and why engagement rate computed from the panel is not comparable to engagement rate computed from public counts alone. The worked example below shows both.
Where to see impressions: app, web, and the analytics dashboard
Impressions live in three places, and the exact labels shift between app releases, so if a label below does not match what you see, look for the bar-chart icon or the word "analytics". The paths here match what X's help pages and guides we checked in 2026 describe.
On the iPhone or Android app, one post. Open a post you wrote and tap the bar-chart (analytics) icon in the row of icons under it. The panel that opens shows impressions at the top, then engagements, and a breakdown that typically includes detail expands, profile visits, link clicks, and, for posts with media, media views or video views.
On the web, one post. Open your post on x.com and either click the bar-chart icon under it or open the three-dot menu in the top right of the post and choose "View post analytics" (the menu wording reported by guides we checked in 2026). The same panel appears with impressions first.
The account dashboard. Visit x.com/i/account_analytics while signed in. The account home shows a rolling 28-day summary of posts, impressions, profile visits, and engagement rate, with the ability to switch ranges. X's help page describes this dashboard as available to accounts that have existed for at least 14 days and that primarily post in supported languages (help.x.com, verified 2026).
X Premium. Several guides we checked in 2026 report that the full analytics dashboard, with account-level impression trends, follower growth history, audience demographics, top posts, and video analytics, is now gated behind an X Premium subscription, while per-post analytics stays available to every account. X's Premium feature list is the authoritative source for what is included at any given time; the gating has changed before and may change again, so verify against that page rather than this one if it matters to you.
What you cannot do is see impressions for a post you did not write. The analytics icon only appears on your own posts. For anyone else, the views counter under the post and the public engagement counts are the limit, and the API section at the end of this page is how to collect those at scale.
Engagement rate: the formula and a worked example
X's activity dashboard reports engagement rate as the number of engagements divided by the number of impressions. That is the whole formula, and it is the reason impressions matter beyond vanity: they are the denominator that turns a raw like count into something you can compare across posts of different sizes.
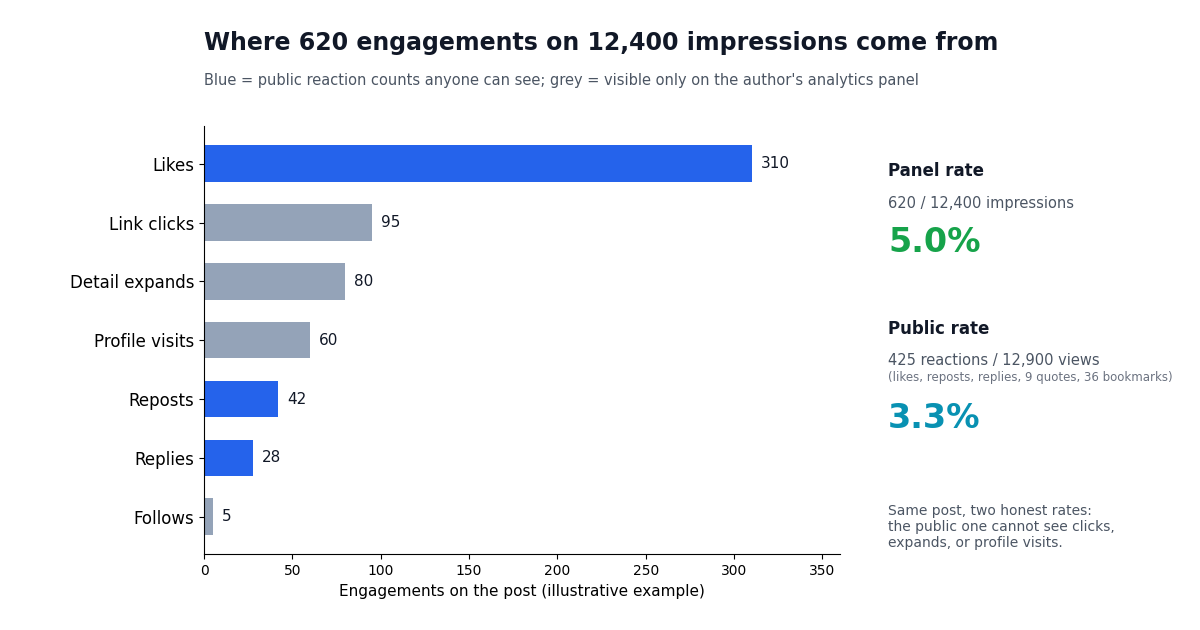
The example. Suppose one of your posts shows 12,400 impressions on the analytics panel and the engagement breakdown reads: 310 likes, 42 reposts, 28 replies, 95 link clicks, 60 profile visits, 80 detail expands, and 5 follows. Add those up and the engagement total is 620. Engagement rate is 620 divided by 12,400, which is 0.05, or 5.0%. These numbers are invented for the example; the arithmetic is what matters.
The same post from the outside. Someone who does not own the post sees a views count (say it reads 12,900, slightly above the private impressions figure, which is common once author views are included) and the public counts: 310 likes, 42 reposts, 28 replies, 9 quotes, and 36 bookmarks. The public engagement total is 425 and the public rate is 425 divided by 12,900, which is about 3.3%. Same post, two legitimate engagement rates, because the public one cannot see clicks, expands, or profile visits.
Which rate to use. Use the panel rate (engagements over impressions) to compare your own posts with each other, because it is the one X computes and it includes the low-effort actions that dominate the total. Use the public rate (reactions over views) when you are benchmarking against accounts you do not own, and only compare public rates with public rates. Mixing the two will make your own posts look roughly 50% better than everyone else's for no real reason.
What a good rate is depends on account size, topic, and post type, and any single benchmark you read online is a vendor's sample, not X's data. Practitioner guides commonly place organic X engagement rates in the low single digits on the panel definition; calibrate against your own last 30 posts rather than against a number from a blog, this one included.
Why impressions drop, and how to tell a real drop from a false alarm
An impressions drop is the most common analytics question on X, and most of the answers online assert causes nobody outside X can verify. What follows separates the checks you can actually run from the explanations that are plausible but unproven.
Check the window first. The account dashboard defaults shift between 7-day, 28-day, and custom ranges, and a 28-day total set against a 7-day total is not a drop. Troubleshooting guides we checked in 2026 list this as the first thing to rule out, and it is also the easiest: set both periods to the same length before comparing.
Check what you posted. Impressions follow volume and format. Fewer posts, more replies than original posts (replies are shown to far fewer people), more posts with external links, or a run of posts on a topic your followers do not engage with will all lower the total without anything on X's side changing. Compare like with like: original posts against original posts, same count, same period.
Check who is still around. If your follower count is flat but impressions fall, the usual explanation in guides we checked is that the audience itself is less active or includes accounts that no longer open X; impressions can only come from people who are on the platform and whose feed X chooses to place you in.
Then the unverifiable part. Changes to X's recommendation ranking are widely reported as a cause of sudden, unexplained drops across many accounts at once, and reduced visibility of specific accounts is widely discussed under the shadowban label. Neither is something you can confirm from your own dashboard. The honest test is a comparison: if accounts similar to yours dropped at the same time, it is probably platform-wide; if only you did, look at your posting behaviour first. You can also run a public check of whether your posts and replies appear in search, which is the only externally observable form of reduced visibility.
Reading the public counts at scale with the API
Everything above works one post at a time, on posts you own. If you want the public engagement rate across the last few hundred posts of any account, yours or a competitor's, an API is the sensible route. On twitterapi.io, GET /twitter/user/last_tweets with a userName returns that account's recent posts, newest first, with has_next_page and next_cursor for paging, and each post carries viewCount, likeCount, retweetCount, replyCount, quoteCount, and bookmarkCount (docs.twitterapi.io, verified 2026). If you already have post IDs, GET /twitter/tweets with tweet_ids returns the same fields for those posts.
Remember what these fields are: they are the public counters, so viewCount is views, not impressions, and the engagement you can compute is the public rate from the worked example (reactions over views), not the panel rate. Impressions, link clicks, detail expands, and profile visits are only visible to the post author on X itself, and no third-party API can return them.
The script below pulls up to a few pages of an account's posts, computes the public engagement rate per post and the median across the sample, and prints the top posts by rate. It costs $0.15 per 1,000 posts returned, so a 200-post sample is about three cents (twitterapi.io/pricing, verified 2026). Set TWITTERAPI_IO_KEY from your dashboard before running it.
import os
import requests

HEADERS = {"X-API-Key": os.environ["TWITTERAPI_IO_KEY"]}  # from twitterapi.io/dashboard


def recent_posts(user_name, max_pages=3):
    """Yield recent posts for one account, newest first, across up to max_pages pages."""
    cursor = ""
    for _ in range(max_pages):
        r = requests.get(
            "https://api.twitterapi.io/twitter/user/last_tweets",
            params={"userName": user_name, "cursor": cursor},
            headers=HEADERS,
            timeout=30,
        )
        r.raise_for_status()
        body = r.json()
        # The tweet list is top-level in the docs; tolerate a data-wrapped shape too.
        page = body.get("tweets") or (body.get("data") or {}).get("tweets") or []
        for t in page:
            yield t
        if not body.get("has_next_page"):
            break
        cursor = body.get("next_cursor") or ""
        if not cursor:
            break


def public_rate(t):
    """Public engagement rate: reactions over views. Views, not impressions."""
    views = t.get("viewCount") or 0
    if not views:
        return None
    reactions = sum(
        t.get(k) or 0
        for k in ("likeCount", "retweetCount", "replyCount", "quoteCount", "bookmarkCount")
    )
    return reactions / views


if __name__ == "__main__":
    rows = []
    for t in recent_posts("twitterapi_io"):
        rate = public_rate(t)
        if rate is not None:
            rows.append((rate, t.get("viewCount"), t.get("id"), (t.get("text") or "")[:60]))
    rows.sort(reverse=True)
    for rate, views, tid, text in rows[:10]:
        print(f"{rate:6.2%}  views={views:>8}  {tid}  {text!r}")
"""Public engagement rate for one account's recent posts.

Reads viewCount and the public reaction counts per post through twitterapi.io,
computes reactions / views per post, and prints the median plus the top posts.
Needs TWITTERAPI_IO_KEY in the environment. Cost: $0.15 per 1,000 posts returned.
"""
import os
import statistics
import sys
import requests

HEADERS = {"X-API-Key": os.environ["TWITTERAPI_IO_KEY"]}
REACTIONS = ("likeCount", "retweetCount", "replyCount", "quoteCount", "bookmarkCount")


def fetch_posts(user_name, max_pages=3):
    cursor = ""
    out = []
    for _ in range(max_pages):
        r = requests.get(
            "https://api.twitterapi.io/twitter/user/last_tweets",
            params={"userName": user_name, "cursor": cursor},
            headers=HEADERS,
            timeout=30,
        )
        r.raise_for_status()
        body = r.json()
        page = body.get("tweets") or (body.get("data") or {}).get("tweets") or []
        out.extend(page)
        if not body.get("has_next_page") or not body.get("next_cursor"):
            break
        cursor = body["next_cursor"]
    return out


def rate(t):
    views = t.get("viewCount") or 0
    if not views:
        return None
    return sum(t.get(k) or 0 for k in REACTIONS) / views


if __name__ == "__main__":
    user = sys.argv[1] if len(sys.argv) > 1 else "twitterapi_io"
    posts = fetch_posts(user)
    scored = [(rate(t), t) for t in posts if rate(t) is not None]
    if not scored:
        print("No posts with a views count returned; older posts may not carry viewCount.")
        sys.exit(0)
    rates = [s for s, _ in scored]
    print(f"{user}: {len(scored)} posts, median public engagement rate {statistics.median(rates):.2%}")
    scored.sort(key=lambda x: x[0], reverse=True)
    for s, t in scored[:5]:
        print(f"  {s:6.2%}  views={t.get('viewCount'):>8}  likes={t.get('likeCount')}  {t.get('url')}")
Questions readers ask
What is an impression on Twitter (X)?
One appearance of a post on someone's screen. X's activity dashboard help page defines it that way and notes the count is not unique, so one person seeing the post twice counts as two impressions. No click or reaction is needed; the post only has to be rendered in a timeline, search result, profile, thread, or quote.
Are impressions the same as views on X?
No, although they are close. Impressions are the author-only distribution count in post analytics. Views are the public counter under every post; X's help page says views count any logged-in viewer, including the author looking at their own post, and count repeat views. The two usually differ by a small margin.
Do impressions mean unique people?
No. Impressions count renders, not people. The unique-people figure is called reach, and X's organic post analytics does not label a reach number; where you see reach for X it is usually a third-party estimate or an ads metric.
What counts as an engagement on X?
Any action on the post. X's help page lists likes, reposts, replies, follows, link clicks, media clicks, profile clicks, detail expands, and clicks anywhere else on the post. That is broader than the public reaction counts, which is why the engagement total on the analytics panel is usually much higher than likes plus reposts plus replies.
How do I calculate engagement rate on X?
Divide engagements by impressions, which is how X's dashboard reports it. Example: 620 engagements on 12,400 impressions is 5.0%. For posts you do not own, you only have public numbers, so use reactions (likes, reposts, replies, quotes, bookmarks) divided by views, and only compare that against other public rates.
Can I see impressions on someone else's post?
No. The analytics icon appears only on your own posts, and no public API field carries impressions. What you can see for any post is the views counter and the public reaction counts, which is what an API such as twitterapi.io returns as viewCount, likeCount, retweetCount, replyCount, quoteCount, and bookmarkCount.
Do I need X Premium to see impressions?
Per-post impressions are available to every account through the analytics panel on your own posts. Guides we checked in 2026 report that the full account analytics dashboard, with trends, demographics, and video analytics, is gated behind X Premium. Check X's current Premium feature list, since the gating has changed before.
Why did my impressions drop even though my follower count did not?
First make sure you are comparing equal windows (7-day against 7-day, not 28-day against 7-day). Then compare what you posted: fewer original posts, more replies, or more external links lower impressions on their own. A less active audience is the other common explanation in guides we checked. Platform-wide ranking changes are widely reported but cannot be confirmed from your dashboard; if similar accounts dropped at the same time, it is probably not you.
Continue
- X Help Center: about your activity dashboard (definitions of impressions, engagements, engagement rate)
- X Help Center: about view counts (who counts as a viewer, repeat views, posts without view counts)
- X Help Center: X Premium features, the authoritative list for what analytics the subscription includes
- twitterapi.io docs: Get User Last Tweets endpoint (viewCount, likeCount, retweetCount, replyCount, quoteCount, bookmarkCount)
- twitterapi.io pricing: $0.15 per 1K tweets, verified 2026
- Sprout Social guide to X analytics (third-party vendor, cited nofollow for the reach and engagement-rate conventions)
- Twitter (X) API overview: reading public post data
- Tracking Twitter (X) account views over time with the API
- Does X show who viewed your profile?
- Build a Twitter (X) engagement-rate calculator with the API
- Twitter (X) analytics: the full metrics guide
- Tweet metadata fields reference (viewCount, likeCount, and the other counts)
- Check whether your posts appear in X search
- twitterapi.io pricing: $0.15 per 1K tweets
Stop reading. Start building.
Starter credits cover real testing on real data. Google sign-in, no card, no application queue.
Get an API key