Twitter (X) Statistics 2026: Attributed Figures and First-Hand Data on the Biggest Accounts
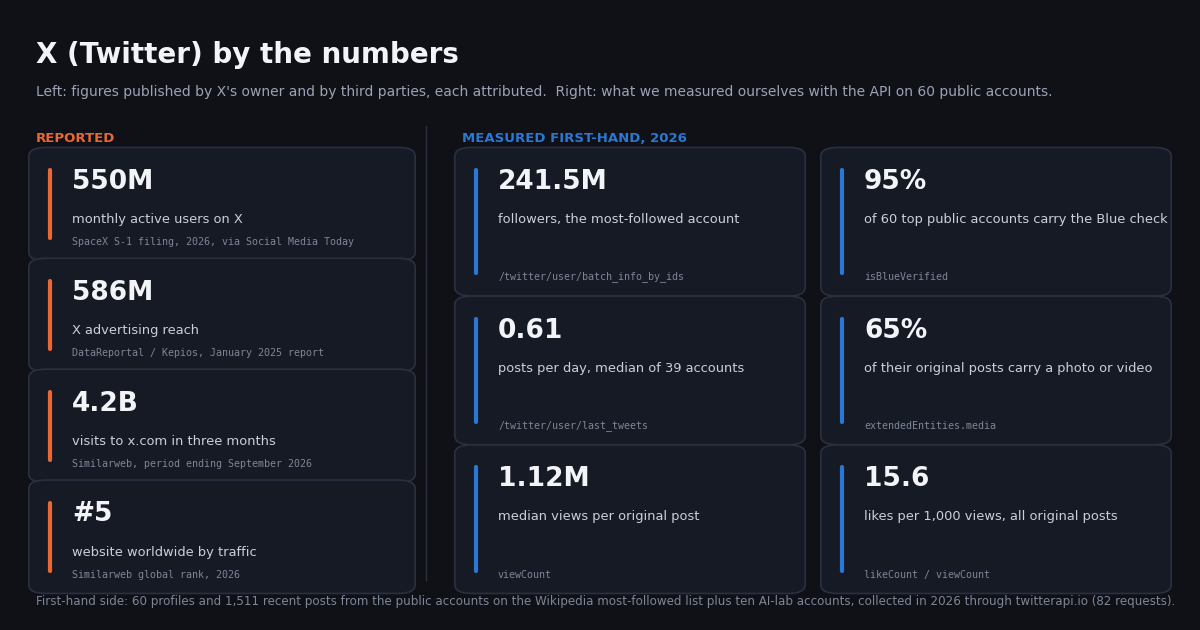
Most pages titled "Twitter statistics" are the same thirty numbers copied from one another, often without a year, sometimes without a source, and almost never with anything the author measured. That matters more for X than for most platforms: the company stopped publishing quarterly reports when it went private in October 2022, so for three and a half years every user figure in circulation was either an executive's statement or a third-party model. This page keeps the two kinds of number apart. The first layer is what X's owner and the main measurement firms have published, each with the source and year named in the sentence. The second layer is what we measured ourselves, in 2026, with the twitterapi.io API, on public accounts anyone can look up.
The first-hand layer covers 60 public accounts: the 50 on Wikipedia's list of most-followed X accounts and ten AI-lab and AI-product accounts (OpenAI, Anthropic, Google DeepMind, Google AI, AI at Meta, Mistral, Grok, Perplexity, Hugging Face, DeepSeek). For all 60 we pulled the profile record (followers, following, lifetime posts, media posts, creation date, verification flags) and for 39 of them the 40 most recent original posts, 1,511 timeline items in total. From that we report follower distribution, posting cadence, media share, views, likes and reposts per view by follower bucket, Blue-check share and account age. Aggregates are in the tables and charts; individual accounts appear only in the top-10 table, and all of them are organizations or public figures.
If you write about X and need a number you can defend, take it from the attributed layer and cite the original. If you need a number nobody else has, take it from the first-hand layer, cite this page, or reproduce the study with the script at the end: 82 requests, $0.24 in credits, no X account required.
How many people use X (Twitter)? The attributed figures
There is exactly one user count for X in a securities filing since the company went private. SpaceX's S-1 registration statement, filed with the SEC in May 2026 ahead of its IPO, states that X has about 550 million monthly active users as of March 2026, up from 520 million in December 2025, and that the Grok chatbot has about 117 million monthly active users; we take these figures from Social Media Today's report on the filing because the SEC document itself could not be fetched during the build. Everything between October 2022 and that filing is an estimate or a statement: Wikipedia's Twitter article attributes to Elon Musk the figures of 500 million monthly active users in March 2023, 550 million in March 2024 and 600 million in May 2024.
Third-party measurements land lower or on a different definition. DataReportal's January 2025 report, built on Kepios' analysis of X's own advertising resources, puts X's potential advertising reach at 586 million users, 10.5% of the world's internet users, and notes that this reach fell 5.3% over the preceding twelve months. Advertising reach is not the same thing as monthly active users: it counts the audience X tells advertisers it can show ads to. On the traffic side, Similarweb's public profile for x.com reports 4.2 billion visits over the three months ending September 2026 and ranks the site fifth worldwide; Pixel Envy, summarizing Similarweb's app data, puts the mobile app at roughly 302 million monthly active users as of June 2026, a number that is hard to reconcile with the filing's 550 million without knowing how each side defines a user.
What we left out. Statista's "number of X/Twitter users worldwide" series is paywalled and its figures were redacted in the public teaser during the build, so we do not quote it. X's own about page returned an error when fetched and in any case does not publish a user count. Any page that gives you a single unsourced "X has N users" figure with no year is, by construction, less reliable than the table above.
Where the audience is: countries, gender, traffic share
Country figures again come from two different instruments. DataReportal's January 2025 report ranks X's advertising audience by country: the United States with 104 million, Japan with 70.9 million, Indonesia with 25.2 million, India with 24.1 million and the United Kingdom with 22.9 million. The same report gives the gender split of that audience as 63.7% male and 36.3% female, based on the gender X's ad tools report rather than a survey.
Similarweb measures web traffic to x.com instead of ad audience, and its country ranking for the period ending September 2026 is the United States at 28.59% of visits, Japan at 11.86% and the United Kingdom at 4.34%. Indonesia and India, large in the ad-reach ranking, do not appear in Similarweb's top three for web visits, which is consistent with those markets being mobile-app-first. Similarweb also reports an average visit of 13 minutes 25 seconds and a 31.4% bounce rate for the site in the same period.
On revenue, the only recent numbers are from the same filing cycle: Techdirt's reading of the S-1, summarized by Pixel Envy, puts X's advertising revenue at $367 million in the second quarter of 2026 against $1.08 billion in the second quarter of 2022, the last full quarter before the acquisition. Treat that as an attributed secondary reading, not as a figure we verified in the filing.
Followers: what the 60 largest public accounts look like, measured in 2026
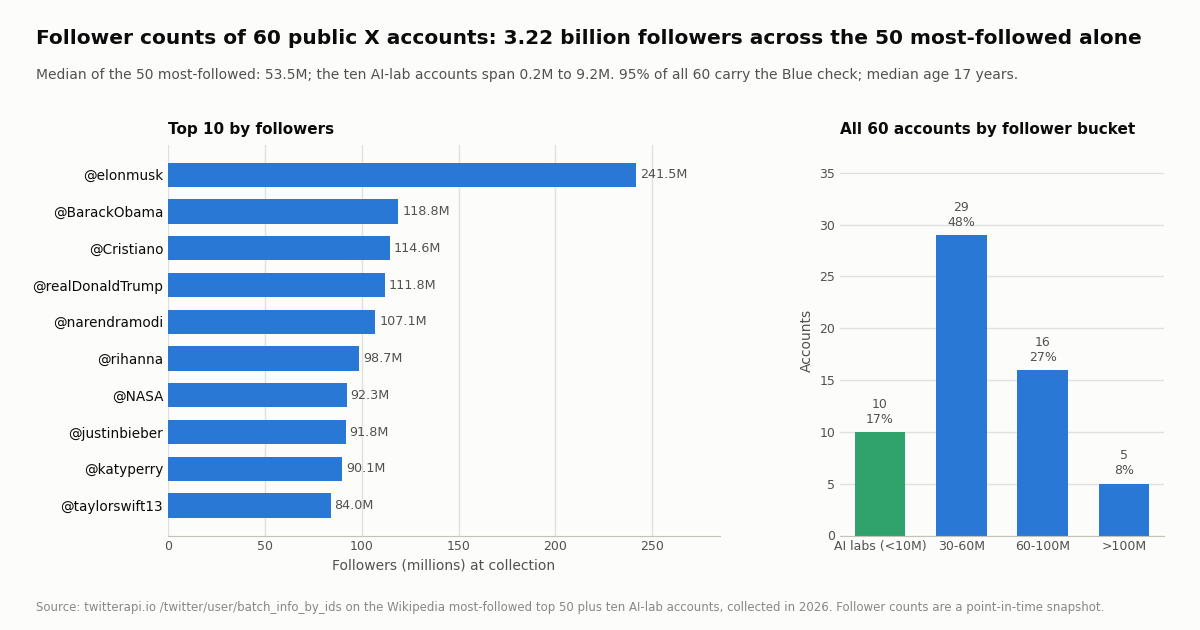
From here on every number is ours. We pulled the profile record of each of the 60 accounts with /twitter/user/batch_info_by_ids (three requests of 20 ids). The most-followed account, @elonmusk, had 241.5 million followers at collection; the tenth, @taylorswift13, had 84.0 million. Across the 50 accounts on the Wikipedia most-followed list the median is 53.5 million, the 90th percentile 99.5 million, the smallest 38.2 million, and the sum 3.22 billion follower relationships, which is why summing followers across accounts says nothing about distinct users. Five accounts sit above 100 million, 16 between 60 and 100 million and 29 between 30 and 60 million.
The ten AI-lab and AI-product accounts are a different order of magnitude: 223,825 followers at the smallest and 9.18 million at the largest, median 1.37 million, 24.1 million combined. They are included because they are the accounts developers actually watch, and because they let us compare engagement at under 10 million followers with engagement above 100 million on the same day with the same method.
Following is tiny relative to followers. The median account follows 132 others; 48 of the 60 (80%) follow fewer than 1,000 and two follow nobody at all. The exception in the top ten is @BarackObama, following 499,502 accounts, a legacy of the account's early follow-back practice. Lifetime post counts (statusesCount) vary from 892 for @taylorswift13 to 110,473 for @elonmusk; the median of the 50 most-followed is 39,539 lifetime posts, of which a median 5,108 are media posts (mediaCount), so roughly one lifetime post in three carried media for this group (33.7% of all their posts combined).
Posting activity: how often the biggest accounts actually post
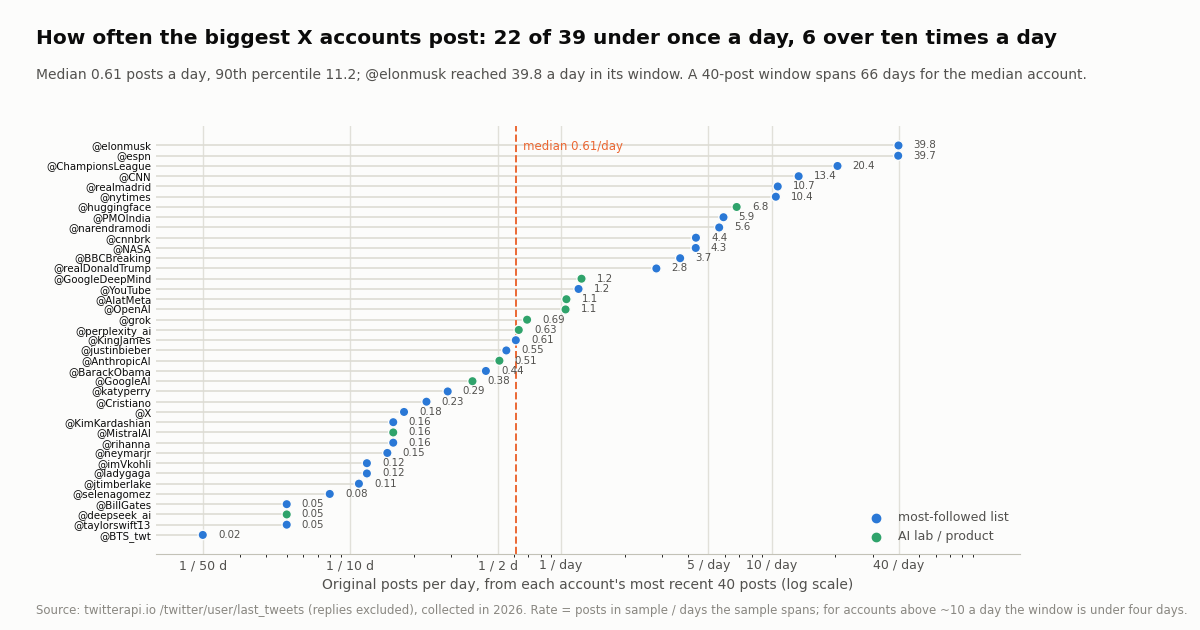
For 40 accounts (the 30 most-followed plus the ten AI accounts) we pulled two pages of /twitter/user/last_tweets, which returns the 20 most recent timeline items per page excluding replies. One account, @TheEllenShow, returned no posts and is excluded, leaving 39 accounts and 1,511 timeline items, of which 1,208 are original posts, 304 (20.1%) are reposts and 109 (7.2%) quote another post. Posting rate is the number of original items divided by the days the sample spans, so for a slow account the 40 posts cover many months and the rate is well estimated, while for the fastest accounts the window is a single day and the rate is a short-window reading.
The median account publishes 0.61 original posts a day. The distribution is wide: 22 of the 39 accounts post less than once a day and 6 post more than ten times a day, with @elonmusk (39.8 a day in a one-day window) and @espn (39.7) at the top, followed by @ChampionsLeague (20.5), @CNN (13.4), @realmadrid (10.7) and @nytimes (10.4). The 90th percentile is 11.2 a day. At the quiet end, @BTS_twt's 28 original posts span four years (0.02 a day) and @taylorswift13's 40 span more than two years (0.05 a day). A 40-post window covers 66 days for the median account.
Broadcasters versus personalities. Every account above ten posts a day is a news or sports publisher or @elonmusk; every account below one post a week is a musician, athlete, or a lab that posts on launches. The AI accounts as a group post slightly more often than the celebrity group (median 0.66 versus 0.55 a day) but with a narrower spread: none of them exceeds seven posts a day (@huggingface, 6.8) and none goes below one post in 20 days (@deepseek_ai, 0.05).
Media, links and post length
Of the 1,208 original posts, 65.1% carry at least one media attachment in extendedEntities.media: 36.3% a photo, 27.9% a video and 0.9% an animated GIF. 39.8% contain at least one URL entity, which includes the t.co links that X attaches to quoted articles and cards. Media share is highest in the 60-100 million bucket (71.8%) and lowest for the AI accounts (58.9%), and it is near-universal for athletes and musicians: @Cristiano, @rihanna and @ChampionsLeague posted media on every original post in the sample, while @nytimes and @BBCBreaking posted none (their posts are headline plus link).
Text-only posts have the highest median views in this sample (1.34 million) but the lowest likes per view (8.5 per 1,000), because the text-only group is dominated by news accounts whose posts are seen widely and liked rarely. Photo posts convert views to likes at 21.4 per 1,000, more than twice the text-only rate. This is a composition effect as much as a format effect: the accounts that post photos are the accounts whose followers like things.
Length. The median original post is 146 characters. 48.0% are 140 characters or shorter, 31.5% fall between 141 and 280, and 20.4% exceed 280 characters, the limit for accounts without a Premium subscription. All 57 Blue-check accounts in the set can post longer text, and the one-in-five share shows how often the largest accounts use it.
Engagement: views, likes and reposts per view, by follower bucket
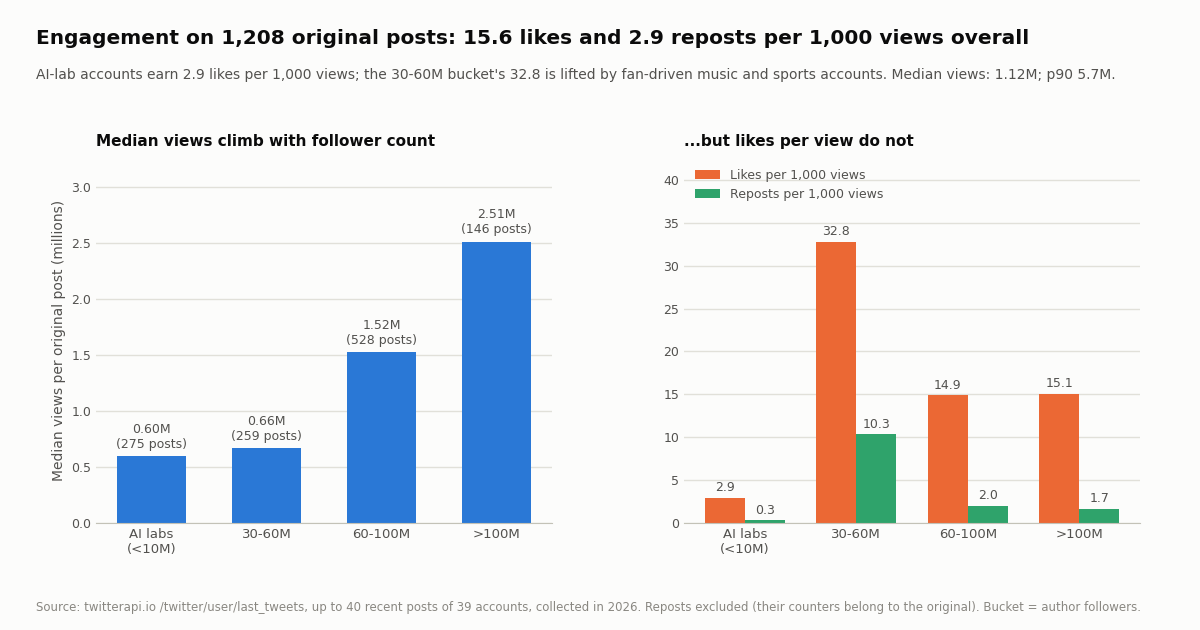
Every post in the sample carried a viewCount (100% present), so views can serve as the denominator. Across all 1,208 original posts the median post reached 1.12 million views and the 90th percentile 5.70 million; the single largest reached 75.7 million. The median post drew 6,546 likes. Summing across the whole set, the accounts earn 15.6 likes, 2.9 reposts, 0.57 replies and 0.53 bookmarks per 1,000 views. Likes per view is the number we recommend quoting, because it does not scale with audience size the way raw likes do.
Median views rise with follower count, from 0.60 million for the AI accounts to 2.51 million above 100 million followers, but the relationship is far from proportional: the top bucket has roughly 30 times the followers of the AI accounts and about four times the median views. Likes per view do not rise with audience at all. The AI accounts earn 2.9 likes per 1,000 views, the two largest buckets about 15, and the 30-60 million bucket 32.8, a figure driven by @BTS_twt (60.7 likes per 1,000 views on a median of 11.3 million views per post) and @ChampionsLeague (21.9). Replies per 1,000 views are low everywhere (0.19 for the AI accounts, 1.17 at 30-60 million).
What the ratio says about audience type. Lab accounts are watched by people who read and move on; fan accounts are watched by people who tap the heart. Among individual accounts, the highest likes-per-view figures belong to @BTS_twt (60.7), @imVkohli (38.8), @Cristiano (24.8), @neymarjr (23.8) and @ChampionsLeague (21.9); the lowest belong to news publishers and labs: @cnnbrk (0.8), @BBCBreaking (1.0), @grok (1.0), @YouTube (1.6) and @CNN (1.6). If you compare an account's engagement rate to a benchmark, compare it to its own category, not to the platform average.
Verification, account age and the dated events behind the numbers
Of the 60 accounts, 57 (95%) carry the Blue check, isBlueVerified: true in the profile record: 48 of the 50 on the most-followed list (96%) and 9 of the 10 AI accounts (90%). None of the 60 carries the legacy isVerified flag, which is consistent with the removal of legacy checkmarks on April 20, 2023 (Wikipedia, Twitter article); the flag still exists in the API response and still reads false for accounts that were verified under the old program. None of the 60 is marked isAutomated.
Account age clusters hard around the platform's early growth. 37 of the 60 (61.7%) were created in 2007, 2008 or 2009; 20 in 2009 alone. The median account is 17 years old, 78.3% are 15 years or older, the oldest were created in 2007 (one year after the July 2006 launch) and the youngest in 2023, all three of them AI labs or products founded that year (@MistralAI, @grok, @deepseek_ai). No account in the most-followed 50 was created after 2016; all six accounts created after 2016 are AI accounts.
The practical reading for anyone building a follower leaderboard or an account-age checker: the top of X is old. No account created in the last decade has reached the most-followed 50, and the fastest-growing newcomer in this set, @grok, created in 2023 and already the largest AI account at 9.2 million followers, is an AI product attached to the platform itself.
The dated events behind the numbers. Several of the figures above only make sense against the platform's timeline, so here are the events we rely on, with their sources. Dates are those given by the Wikipedia Twitter article unless stated otherwise.
We did not verify the exact day of the acquisition closing or the month of the 280-character change beyond what the Wikipedia article states, so those two rows carry the coarser date.
What it costs to pull these numbers: X API rate card versus twitterapi.io
A page like this is cheap to reproduce, and the comparison is worth stating because it decides whether a writer can refresh the numbers themselves. On X's official pay-per-usage rate card (docs.x.com/x-api/getting-started/pricing, read during the build) a post read costs $0.005 and a user read $0.010, with pay-per-usage capped at 3 million post reads per monthly billing cycle and Enterprise above that; new accounts get $20 in credits on a first eligible card plus a match of the first auto-recharge up to $50. Our 1,511 timeline items and 60 profiles would have cost about $7.56 plus $0.60, roughly $8.16, on that card.
On twitterapi.io the tweet endpoints, including /twitter/user/last_tweets, cost 15 credits per tweet returned ($0.15 per 1,000 tweets, with a 15-credit minimum per request so an empty page costs $0.00015 and a full 20-tweet page $0.003) and profile endpoints cost 18 credits per user ($0.18 per 1,000 profiles). Credits are $1 per 100,000, so the same study cost $0.24: 1,511 posts at 15 credits, 60 profiles at 18 credits, plus one empty page at the minimum. Per 1,000 tweets that is $5 on X's rate card against $0.15 here, about 33 times less, and reads need no X account.
New accounts that pass the automatic bot check receive up to $1 of free credits (at most 100,000 credits, no card, one per person or network, expiring after 31 days), enough to run this study four times over. Rate limits are 0.2 requests per second before the first payment and 20 once paid; the plan table is on the pricing page, linked below, and we do not compute effective per-request prices here.
How we collected this
Question. What do the most-followed public accounts on X look like in first-hand numbers today: follower distribution, posting cadence, media share, views and likes per view by follower bucket, Blue-check share and account age?
Accounts. The first 60 entries of a fixed public list: the 50 accounts on Wikipedia's list of most-followed X accounts (top 50, read in 2026) and ten AI-lab and AI-product accounts. Profiles were pulled for all 60; recent posts for the 30 most-followed plus the ten AI accounts. All are organizations or public figures. No searches, no mentions, no follower lists.
Window and sample. Profile metrics are a point-in-time snapshot. Posts are each account's two most recent pages of /twitter/user/last_tweets without replies: 1,511 timeline items from 39 accounts (one returned nothing), 1,208 of them original posts. The per-account window runs from the oldest to the newest post in the sample, 66 days for the median account, one day for the fastest. Collected in 2026 in 82 requests, $0.24 in credits.
Method. scripts/studies/twapi.py, a rate-limited read-only client, called /twitter/user/batch_info_by_ids (20 ids per request) and /twitter/user/last_tweets with --pages 2. Ratios (likes, reposts, replies, bookmarks per 1,000 views) are computed on original posts only, summing numerators and denominators across posts; reposts are excluded because their counters belong to the original author. Posting rate is original posts divided by days spanned. Buckets use the author's follower count at collection.
What this cannot show. Nothing here describes the typical X user or the typical account; it describes the largest public accounts, which are not representative of anything but themselves. Follower counts include inactive and automated followers, which the API does not separate. A 40-post window undercounts cadence for accounts that post in bursts and overstates it for accounts captured on a busy day. Views are X's own counter, whose definition is not public. The attributed layer mixes three definitions (monthly active users, advertising reach, web visits) that should never be compared with each other as if they measured the same thing.
Privacy. Aggregates only, plus a top-10 table of accounts that already appear on a public Wikipedia list. No private individuals were profiled, no reply or repost targets were analyzed, and the page uses no customer or internal usage data. Raw API pages are committed gzip-compressed with the study because every account is an organization or public figure.
Cite this page. TwitterAPI.io, Twitter (X) Statistics: Attributed Figures and First-Hand Data on the Biggest Accounts, twitterapi.io/blog/x-twitter-statistics, 2026. When you quote a first-hand number, say "measured on 60 top public accounts in 2026"; when you quote an attributed number, cite the original source named next to it.
"""x_stats.py - reproduce the first-hand layer of the X (Twitter) statistics page.

Pulls profile records for a list of public accounts with /twitter/user/batch_info_by_ids,
then the two most recent pages of /twitter/user/last_tweets for each, and prints a
follower table plus likes per 1,000 views by follower bucket. Reads only; no X account needed.
"""
import os
import statistics

import requests

BASE = "https://api.twitterapi.io"
HEADERS = {"X-API-Key": os.environ["TWITTERAPI_IO_KEY"]}

# user ids of public organization / public-figure accounts (NASA, YouTube, OpenAI, AnthropicAI)
USER_IDS = ["11348282", "10228272", "4398626122", "1353836358901501952"]


def profiles(user_ids):
    """/twitter/user/batch_info_by_ids returns users[] in camelCase, 18 credits per user."""
    out = []
    for i in range(0, len(user_ids), 20):
        r = requests.get(
            f"{BASE}/twitter/user/batch_info_by_ids",
            headers=HEADERS,
            params={"userIds": ",".join(user_ids[i:i + 20])},
            timeout=30,
        )
        r.raise_for_status()
        out.extend(r.json().get("users") or [])
    return out


def last_tweets(user_name, pages=2):
    """/twitter/user/last_tweets: data.tweets[], 20 per page, newest first, 15 credits per tweet."""
    tweets, cursor = [], None
    for _ in range(pages):
        params = {"userName": user_name}
        if cursor:
            params["cursor"] = cursor
        r = requests.get(f"{BASE}/twitter/user/last_tweets", headers=HEADERS, params=params, timeout=30)
        r.raise_for_status()
        body = r.json()
        tweets.extend((body.get("data") or {}).get("tweets") or [])
        if not body.get("has_next_page") or not body.get("next_cursor"):
            break
        cursor = body["next_cursor"]
    return tweets


def bucket(followers):
    if followers >= 100_000_000:
        return ">100M"
    if followers >= 60_000_000:
        return "60-100M"
    if followers >= 30_000_000:
        return "30-60M"
    if followers >= 10_000_000:
        return "10-30M"
    return "<10M"


users = profiles(USER_IDS)
users.sort(key=lambda u: -(u.get("followers") or 0))
print(f"{'account':<18}{'followers':>14}{'following':>11}{'posts':>9}  blue  created")
for u in users:
    print(
        f"@{u['userName']:<17}{u.get('followers', 0):>14,}{u.get('following', 0):>11,}"
        f"{u.get('statusesCount', 0):>9,}  {str(bool(u.get('isBlueVerified'))):<5} {str(u.get('createdAt', ''))[:4]}"
    )

likes_by_bucket, views_by_bucket, views_all = {}, {}, []
for u in users:
    b = bucket(u.get("followers") or 0)
    for t in last_tweets(u["userName"]):
        if t.get("retweeted_tweet"):
            continue  # a repost carries the original post's counters
        views = t.get("viewCount") or 0
        likes_by_bucket[b] = likes_by_bucket.get(b, 0) + (t.get("likeCount") or 0)
        views_by_bucket[b] = views_by_bucket.get(b, 0) + views
        views_all.append(views)

print(f"\nmedian views per original post: {int(statistics.median(views_all)):,}")
for b, v in sorted(views_by_bucket.items()):
    print(f"{b:>8}: {1000 * likes_by_bucket[b] / max(1, v):.1f} likes per 1,000 views")
Questions readers ask
How many people use X (Twitter) in 2026?
The only recent figure in a securities filing is about 550 million monthly active users as of March 2026, stated in SpaceX's S-1 registration statement of May 2026 and reported by Social Media Today (up from 520 million in December 2025). DataReportal's January 2025 report measured X's advertising reach at 586 million, a different definition. Earlier numbers (500 million in March 2023, 600 million in May 2024) were statements by Elon Musk, not audited figures.
Why do Twitter statistics pages disagree so much on the user count?
Because the company went private in October 2022 and stopped filing quarterly reports, so until the May 2026 S-1 every number was an executive statement, an advertising-reach estimate (DataReportal), or a traffic or app-panel estimate (Similarweb, whose app data suggests roughly 302 million monthly actives as of June 2026). These measure different things. Always quote the source and the definition next to the number.
Who has the most followers on X?
In our 2026 pull of the profile records, @elonmusk had 241.5 million followers, followed by @BarackObama (118.8 million), @Cristiano (114.6 million), @realDonaldTrump (111.8 million) and @narendramodi (107.1 million). Five accounts exceed 100 million; the median of the 50 most-followed is 53.5 million. Follower counts move daily, so re-pull them with /twitter/user/batch_info_by_ids before you publish.
What is a good engagement rate on X?
On 1,208 original posts by 39 of the largest public accounts we measured 15.6 likes per 1,000 views overall, but the spread by account type is the real answer: AI-lab accounts earned 2.9 likes per 1,000 views, news publishers around 1, and fan-driven music and sports accounts 20 to 60. Compare an account to its own category, and use views as the denominator rather than followers, because views are present on every post and follower counts include inactive accounts.
How often do the biggest X accounts post?
The median account in our sample publishes 0.61 original posts a day. 22 of 39 post less than once a day (musicians, athletes, labs), while 6 post more than ten times a day (news and sports publishers, and @elonmusk at about 40 a day in a one-day window). Reposts make up 20.1% of timeline items and quotes 7.2%.
What share of posts on X include a photo or video?
Among the largest public accounts, 65.1% of original posts carry media: 36.3% a photo, 27.9% a video, 0.9% an animated GIF. Text-only posts had the highest median views (1.34 million) but the lowest likes per view (8.5 per 1,000), because the text-only group is dominated by news accounts. This is a measurement of top accounts, not of the whole platform.
Can I reuse these statistics in my article?
Yes. First-hand numbers are free to cite with attribution: TwitterAPI.io, Twitter (X) Statistics, twitterapi.io/blog/x-twitter-statistics, 2026, measured on 60 top public accounts. For the attributed layer, cite the original source named next to each figure (the SpaceX S-1 as reported by Social Media Today, DataReportal, Similarweb) rather than this page.
How can I refresh these numbers myself?
Run the script at the end of this page with a twitterapi.io key: /twitter/user/batch_info_by_ids for the profiles (18 credits per user) and /twitter/user/last_tweets for recent posts (15 credits per tweet returned). Our full pull of 60 profiles and 1,511 posts took 82 requests and $0.24 in credits; the same reads cost about $8.16 on X's official pay-per-usage rate card at $0.005 per post read and $0.010 per user read.
Continue
- X API pricing: $0.005 per post read, $0.010 per user read, 3M post reads per month cap on pay-per-usage, $20 first-card credit and up to $50 match
- DataReportal, Essential X statistics: 586 million ad reach in January 2025, -5.3% year on year, country and gender breakdown (Kepios analysis)
- Similarweb profile for x.com: 4.2B visits in the three months to September 2026, global rank #5, country share of traffic
- Social Media Today on the SpaceX S-1 filing: ~550 million X monthly active users as of March 2026, 520 million in December 2025, ~117 million Grok users
- Pixel Envy summarizing Techdirt's reading of the S-1: X ad revenue $367M in Q2 2026 vs $1.08B in Q2 2022; Similarweb app estimate ~302M monthly actives, June 2026
- Wikipedia, Twitter: launch July 15, 2006; 280-character limit 2017; acquisition October 2022; legacy checkmarks removed April 20, 2023; rebrand to X July 2023; Musk's stated user figures 2023-2024
- twitterapi.io API reference: /twitter/user/batch_info_by_ids, /twitter/user/last_tweets, response fields and credit prices
- X (Twitter) API overview: endpoints, pricing and rate limits
- Twitter (X) analytics guide: metrics, methods and tools
- Pulling Twitter (X) stats through the API, step by step
- Who has the most Twitter (X) followers: an API-built leaderboard
- How to get any account's follower count with the API
- Twitter (X) engagement rate calculator
- Twitter (X) account age checker
- twitterapi.io pricing: pay only for the data returned
- 01Twitter (X) to SMS: Get a Text Message When an Account Posts
- 02Tweet Hunter (TweetHunter) Review: What It Automates, What It Costs, and the API Route for the Data Half
- 03How to Search Twitter (X) for Images: Operators, What They Return, and the API Route
- 04SOCMINT on Twitter (X): What Social Media Intelligence Is, and a Worked Method
- 05Twitter (X) Bookmarklets: 6 Working Scripts for x.com in 2026
- 06Twitter (X) Bulk Unfollow + Follower Remover — API Guide
- 07What Does RT Mean on Twitter (X), and How Do You RT a Post?
- 08Historical Twitter (X) Data + Archive API — Complete Guide
Stop reading. Start building.
Starter credits cover real testing on real data. Google sign-in, no card, no application queue.
Get an API key