TweetStats Alternative: How to Graph Your Tweet Stats Now That TweetStats Is Gone
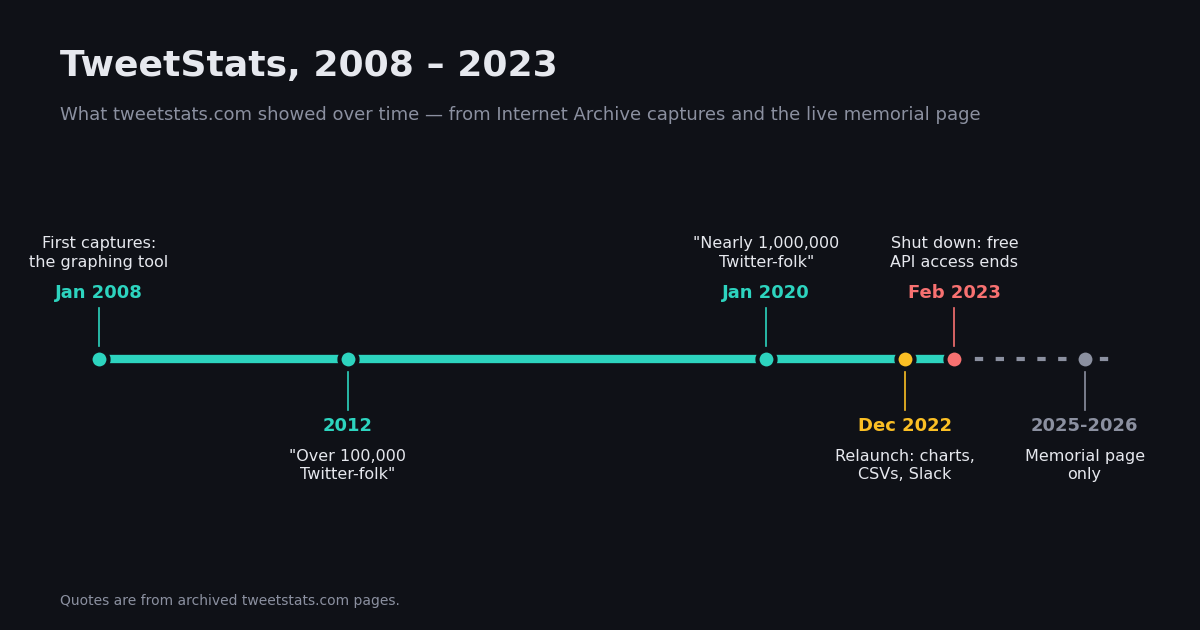
If you used Twitter between 2008 and 2022, there's a fair chance you typed your username into TweetStats at least once to see your tweets per hour or your TweetCloud. Its homepage said it was "in use by over 100,000 Twitter-folk" in 2012 and "nearly 1,000,000 Twitter-folk" by January 2020, per Internet Archive captures. Searching for it today lands you on a memorial page.
This page covers what happened to TweetStats, using the live site and archived captures rather than guesses; lists exactly what it charted; maps each chart to a working replacement; and gives a runnable Python script that rebuilds the full TweetStats graph set for any public account. If you want the raw metric fields rather than the graphs, the Twitter stats API guide linked below goes into likes, views and impressions in more detail.
What happened to TweetStats
We checked the live domain and pulled the Internet Archive's capture index (the Wayback Machine CDX API) for tweetstats.com, then opened captures from each period.
On the memorial page, Damon Cortesi writes that the first version "simply scraped the website" because the Twitter API didn't exist yet, and that he shut the site down when free API access ended: "Access to the data is no longer free, and I have no desire to keep this site running." That's the creator's own account, so there's no ambiguity about whether it's coming back. The bare tweetstats.com hostname returned a 502 error when we checked; www.tweetstats.com serves the memorial.
Every TweetStats graph and what replaces it
An archived TweetStats results page (captured August 2014) lists the full set of views it produced for an account. All of them can be rebuilt from fields on each tweet.
Field names come from the TwitterAPI.io OpenAPI spec. One TweetStats view is weaker than it used to be: "interface used" depends on X still exposing a meaningful source value for the tweet, so expect more generic labels on recent tweets than you'd have seen in 2014.
Free options, and where they fall short
X's built-in analytics. If you only care about your own account, start here. It shows impressions and engagement that no outside tool can see, such as profile visits and link clicks. It isn't built around TweetStats' view of posting habits (when you tweet, who you reply to, which words you lean on), and it can't show anyone else's account.
Your X data archive. X lets you download an archive of your own account from settings. It contains every tweet with a timestamp, so you can build TweetStats-style charts from it in a spreadsheet. It's complete and free, but it's your account only and you have to request a fresh archive each time.
X advanced search. Searching from:username since:2026-01-01 until:2026-02-01 on x.com shows an account's tweets for a month, which is enough to eyeball activity but gives you no counts or charts.
For graphs of any public account, refreshed whenever you want, you need the tweets as data. That's what the API route below provides.
Rebuild the core graphs with the API
TwitterAPI.io's advanced_search takes X's search syntax. Per its docs, date bounds go in as unix timestamps with since_time: and until_time:; results come back newest-first in pages with has_next_page and next_cursor. The snippet below pulls six months of an account's tweets and prints the two charts people remember most from TweetStats: tweets per month and tweets per hour.
createdAt is in UTC (for example Tue Dec 10 07:00:30 +0000 2024). Convert it to the account's local timezone before reading anything into the per-hour chart.
# The two core TweetStats graphs: tweets per month and per hour (UTC)
import os, requests
from collections import Counter
from datetime import datetime, timezone

HEADERS = {"X-API-Key": os.environ["TWITTERAPI_IO_KEY"]}
lo = int(datetime(2026, 1, 1, tzinfo=timezone.utc).timestamp())
hi = int(datetime(2026, 7, 1, tzinfo=timezone.utc).timestamp())
query = f"from:nasa since_time:{lo} until_time:{hi}"

cursor, tweets = "", []
while True:
    r = requests.get(
        "https://api.twitterapi.io/twitter/tweet/advanced_search",
        headers=HEADERS,
        params={"query": query, "queryType": "Latest", "cursor": cursor},
        timeout=20,
    )
    r.raise_for_status()
    body = r.json()
    tweets += body.get("tweets", [])
    if not body.get("has_next_page"):
        break
    cursor = body["next_cursor"]

stamps = [datetime.strptime(t["createdAt"], "%a %b %d %H:%M:%S %z %Y") for t in tweets]
print("per month:", sorted(Counter(s.strftime("%Y-%m") for s in stamps).items()))
print("per hour :", sorted(Counter(s.hour for s in stamps).items()))The full TweetStats replacement script
The script at the bottom of this page does the rest. It walks a date range one month at a time (smaller queries are easier to retry), then produces a four-panel PNG (timeline, weekday, hour, density heatmap), a CSV of every tweet for your own analysis, and printed top-10 lists for @replies, interface used, reposts, TweetCloud and HashCloud.
It needs requests and matplotlib, plus a TWITTERAPI_IO_KEY environment variable. Change HANDLE, START and END at the top. Reposts are counted only where the search results include them (they carry a retweeted_tweet object), and they're left out of the TweetCloud so other people's words don't fill your cloud.
Cost: TwitterAPI.io vs the official X API
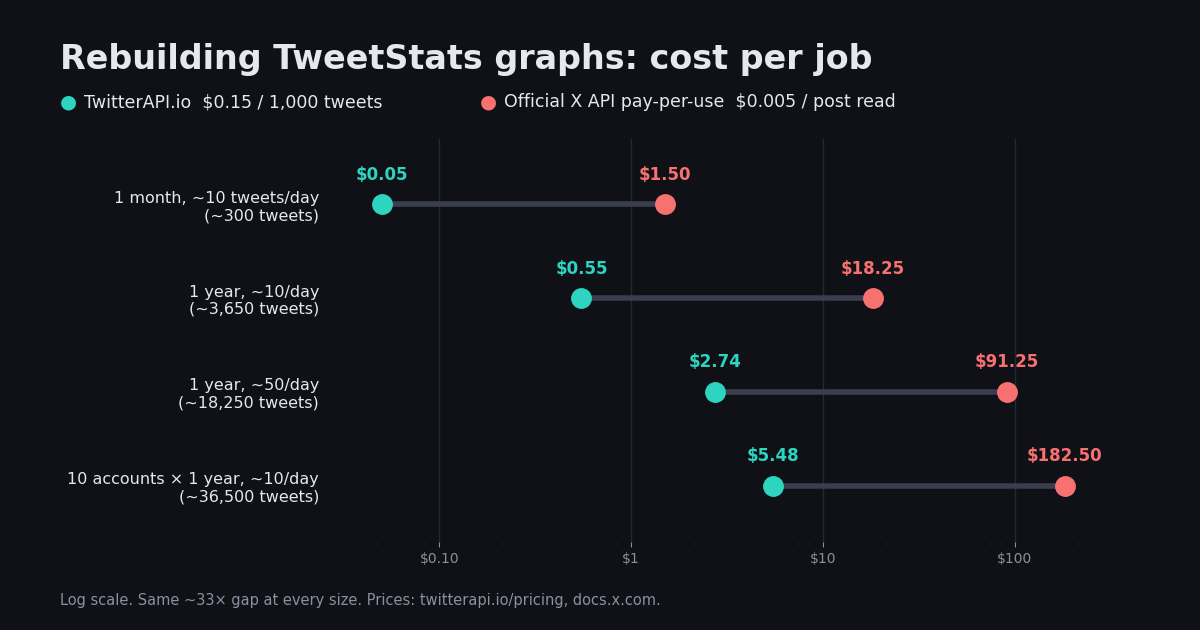
TweetStats was free because it ran on Twitter's free API. Today both data routes are paid per tweet read. Prices: twitterapi.io/pricing lists $0.15 per 1,000 tweets; docs.x.com pay-per-use pricing lists $0.005 per post read. The account sizes below are example inputs.
The ratio is $0.005 ÷ $0.00015 ≈ 33× per tweet. The X API user-posts timeline also only accepts start_time values on or after 2010-11-06 (docs.x.com), while search-based pulls work by date window.
Which TweetStats alternative fits you?
If you collect other people's tweets for research or publication, check X's developer terms and your organization's data policy first.
# TweetStats-style graphs for any public X account: tweet timeline, tweets per
# weekday and hour, density heatmap, top @replies, posting clients, reposted
# accounts, TweetCloud and HashCloud, saved as tweetstats_<handle>.png + .csv
import os, re, csv, requests
from collections import Counter
from datetime import datetime, timezone
import matplotlib
matplotlib.use("Agg")
import matplotlib.pyplot as plt

HEADERS = {"X-API-Key": os.environ["TWITTERAPI_IO_KEY"]}
HANDLE = "nasa"
START, END = (2025, 10), (2026, 9)  # inclusive (year, month)
STOP = set("the a an and or to of in on for is it at be this that with i you my me we our are was rt https co amp".split())

def months(start, end):
    y, m = start
    while (y, m) <= end:
        yield y, m
        y, m = (y + 1, 1) if m == 12 else (y, m + 1)

def month_bounds(y, m):
    lo = datetime(y, m, 1, tzinfo=timezone.utc)
    hi = datetime(y + (m == 12), m % 12 + 1, 1, tzinfo=timezone.utc)
    return int(lo.timestamp()), int(hi.timestamp())

def fetch_month(y, m):
    lo, hi = month_bounds(y, m)
    query = f"from:{HANDLE} since_time:{lo} until_time:{hi}"
    cursor, out = "", []
    while True:
        r = requests.get(
            "https://api.twitterapi.io/twitter/tweet/advanced_search",
            headers=HEADERS,
            params={"query": query, "queryType": "Latest", "cursor": cursor},
            timeout=20,
        )
        r.raise_for_status()
        body = r.json()
        out += body.get("tweets", [])
        if not body.get("has_next_page"):
            return out
        cursor = body["next_cursor"]

tweets = [t for y, m in months(START, END) for t in fetch_month(y, m)]
for t in tweets:
    t["_dt"] = datetime.strptime(t["createdAt"], "%a %b %d %H:%M:%S %z %Y")

per_month = Counter(t["_dt"].strftime("%Y-%m") for t in tweets)
per_weekday = Counter(t["_dt"].weekday() for t in tweets)
per_hour = Counter(t["_dt"].hour for t in tweets)
density = [[0] * 24 for _ in range(7)]
for t in tweets:
    density[t["_dt"].weekday()][t["_dt"].hour] += 1
replied_to = Counter(t.get("inReplyToUsername") for t in tweets if t.get("isReply") and t.get("inReplyToUsername"))
clients = Counter(t.get("source") or "unknown" for t in tweets)
reposted = Counter(((t.get("retweeted_tweet") or {}).get("author") or {}).get("userName")
                   for t in tweets if t.get("retweeted_tweet"))
reposted.pop(None, None)
hashtags = Counter(h["text"].lower() for t in tweets for h in (t.get("entities") or {}).get("hashtags") or [])
words = Counter(w for t in tweets if not t.get("retweeted_tweet")
                for w in re.findall(r"[a-z']{3,}", re.sub(r"https?://\S+|@\w+|#\w+", "", t.get("text", "").lower()))
                if w not in STOP)

fig, ax = plt.subplots(2, 2, figsize=(14, 9))
labels = [f"{y}-{m:02d}" for y, m in months(START, END)]
ax[0][0].bar(labels, [per_month[k] for k in labels], color="#1d9bf0")
ax[0][0].set_title("Tweet timeline (per month)")
ax[0][0].tick_params(axis="x", rotation=60)
ax[0][1].bar(["Mon", "Tue", "Wed", "Thu", "Fri", "Sat", "Sun"], [per_weekday[d] for d in range(7)], color="#1d9bf0")
ax[0][1].set_title("Tweets per weekday (UTC)")
ax[1][0].bar(range(24), [per_hour[h] for h in range(24)], color="#1d9bf0")
ax[1][0].set_title("Tweets per hour (UTC)")
im = ax[1][1].imshow(density, aspect="auto", cmap="Blues")
ax[1][1].set_yticks(range(7), ["Mon", "Tue", "Wed", "Thu", "Fri", "Sat", "Sun"])
ax[1][1].set_title("Tweet density (weekday x hour, UTC)")
fig.colorbar(im, ax=ax[1][1])
fig.suptitle(f"TweetStats-style graphs for @{HANDLE}: {len(tweets)} tweets")
fig.tight_layout()
fig.savefig(f"tweetstats_{HANDLE}.png", dpi=120)

with open(f"tweetstats_{HANDLE}.csv", "w", newline="") as f:
    w = csv.writer(f)
    w.writerow(["id", "createdAt", "isReply", "inReplyToUsername", "source", "likeCount", "retweetCount", "viewCount", "text"])
    for t in tweets:
        w.writerow([t["id"], t["createdAt"], t.get("isReply"), t.get("inReplyToUsername"), t.get("source"),
                    t.get("likeCount"), t.get("retweetCount"), t.get("viewCount"), t.get("text")])

for title, c in [("Top @replies", replied_to), ("Interface used", clients), ("Reposts of", reposted),
                 ("TweetCloud", words), ("HashCloud", hashtags)]:
    print(f"{title}: " + ", ".join(f"{k} ({v})" for k, v in c.most_common(10)))
print(f"{len(tweets)} tweets, approx cost ${len(tweets) * 0.00015:.2f}")
Questions readers ask
Is TweetStats still working?
No. www.tweetstats.com now shows a memorial page reading "In memory of TweetStats, January 2008 - February 2023". Its creator shut it down when Twitter's free API access ended.
Who made TweetStats?
Damon Cortesi (@dacort). According to his memorial page, he launched it in January 2008 and the first version scraped the Twitter website because the API didn't exist yet.
What did TweetStats show?
A tweet timeline by month, tweets per weekday and per hour, a weekday-by-hour density chart, the accounts you replied to most, the apps you tweeted from, whose tweets you retweeted, and word and hashtag clouds.
How can I see my tweets per hour now?
Pull your tweets with their createdAt timestamps and count them by hour, converting from UTC to your timezone first. The script on this page does this for any public account and saves the chart as a PNG.
Can I get TweetStats-style graphs for someone else's account?
Yes, for public accounts. Posting times, reply targets, hashtags and engagement counts are public. X's built-in analytics only covers your own account.
How much does it cost to graph a year of tweets?
For an account posting about 10 times a day, roughly 3,650 tweets: about $0.55 on TwitterAPI.io at $0.15 per 1,000 tweets, versus about $18.25 on the official X API at $0.005 per post read.
Continue
- TweetStats memorial page by Damon Cortesi — "January 2008 - February 2023"
- Internet Archive Wayback Machine — tweetstats.com capture history (2008-2026)
- TwitterAPI.io docs — advanced_search query, since_time/until_time, cursor pagination
- TwitterAPI.io OpenAPI spec — Tweet fields (createdAt, isReply, inReplyToUsername, source, entities, retweeted_tweet)
- X Developer Platform — pay-per-use pricing ($0.005 per post read)
- X Developer Platform — user posts timeline (start_time on or after 2010-11-06)
- Twitter (X) analytics: free tools and API
- Twitter stats API: public vs private metrics
- Twitter analytics report template
- TweetTunnel alternative for old tweets
- Topsy Twitter analytics alternative
- Export a Twitter account's tweet history via API
- Twitter (X) API — endpoint hub
- TwitterAPI.io pay-per-call pricing
Stop reading. Start building.
Starter credits cover real testing on real data. Google sign-in, no card, no application queue.
Get an API key