Chrome DevTools MCP Server: What It Is, Setup, Tools and Flags (2026)
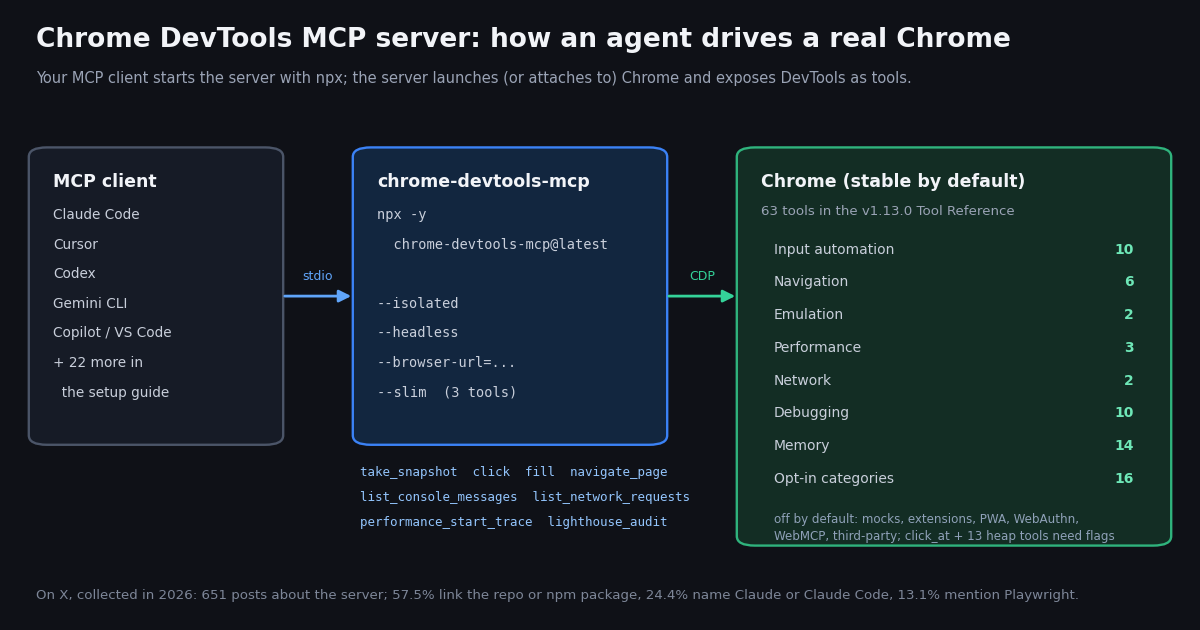
- What it is: Google's
chrome-devtools-mcppackage, an MCP server (and achrome-devtoolsCLI) that gives a coding agent a real Chrome with DevTools: input, navigation, emulation, performance traces, network, console, Lighthouse. - Install: add
npx -y chrome-devtools-mcp@latestas a stdio server; Claude Code:claude mcp add chrome-devtools --scope user npx chrome-devtools-mcp@latest; Codex:codex mcp add chrome-devtools -- npx chrome-devtools-mcp@latest; Gemini CLI:gemini mcp add chrome-devtools npx chrome-devtools-mcp@latest. - Tools: 63 in the v1.13.0 Tool Reference across 13 categories; a default start exposes 33 of them, because opt-in categories and the
click_atand heap-analysis tools sit behind flags.--slimcuts it to 3 tools. - Flags that matter:
--isolated(throwaway profile),--headless,--browser-urlor--autoConnect(attach to a Chrome you started),--allowed-url-pattern/--blocked-url-pattern,--no-usage-statistics,--no-performance-crux. - What people do with it on X: in 651 posts collected in 2026, 24.4% name Claude or Claude Code, 21.7% talk about console errors and debugging, and 13.1% mention Playwright.
- Live X data is a different server: Chrome DevTools MCP drives a browser; to give the same agent X (Twitter) data, add a data MCP server or call a REST API, at $0.15 per 1,000 tweets returned on TwitterAPI.io.
Chrome DevTools MCP closes the loop that coding agents used to leave open: the agent writes front-end code but cannot see what the page actually does. With the server connected, the same agent can open the page in Chrome, read the console, inspect the failing network request, record a performance trace and check that its fix worked. Google announced the public preview on the Chrome for Developers blog on September 23, 2025; the repository has shipped frequent releases since, and v1.13.0 is the current npm version as of this writing.
This page covers Google's server only: what it is, the install command for each major client (copied from the project's own setup guide), the tool list by category with the exact counts, the flags worth knowing, the security and privacy defaults, and a worked QA session on a public page. It is not about Browser Use's MCP server, a different product built around a Python agent library (our Browser Use MCP guide covers that), and it is not a general primer on how MCP servers work (see our MCP server explainer). We also measured how developers talk about the server on X, with a study of 651 posts, because the question of which agent to pair it with is easier to answer with numbers.
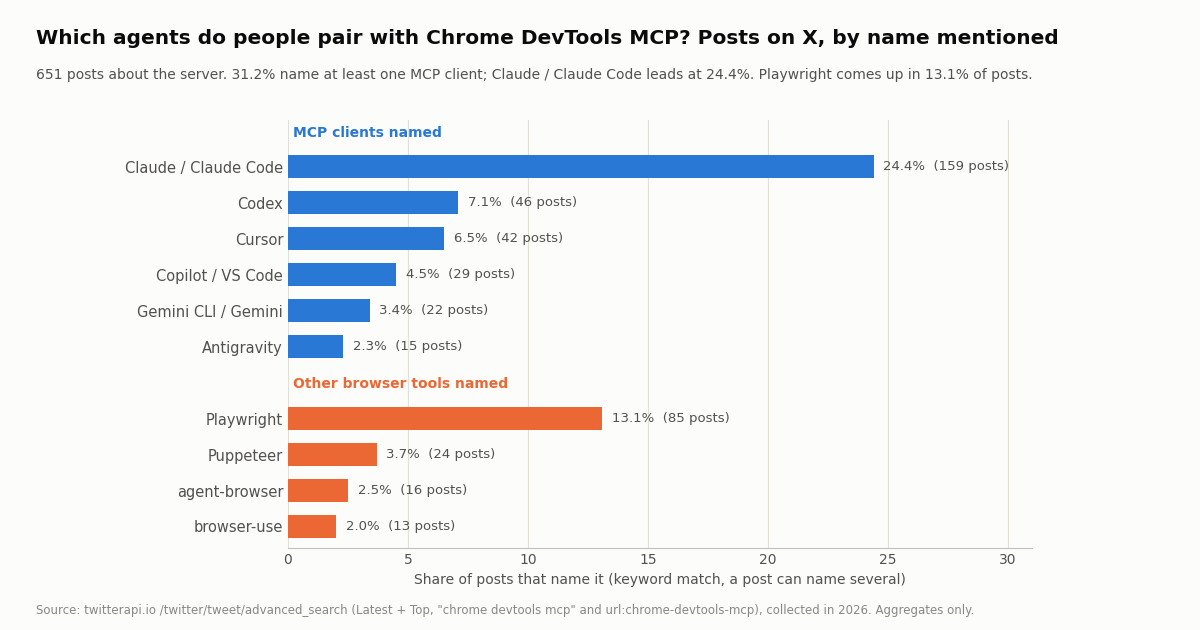
24.4% of 651 posts on X (collected in 2026), ahead of Codex at 7.1% and Cursor at 6.5%; bookmarks outnumber likes 1.28 to 1.
What the Chrome DevTools MCP server is
The project lives at github.com/ChromeDevTools/chrome-devtools-mcp under the Apache-2.0 license, and its README now calls it "Chrome DevTools for agents". It ships two front ends from one npm package: an MCP server that any MCP client can start, and a chrome-devtools command-line tool for driving the same browser from a shell without MCP. Both use Puppeteer to automate Chrome and wait for the result of each action, and both use the DevTools front end to record traces and turn them into performance insights.
Three things set it apart from a generic browser-automation server. First, it is DevTools, not just a remote control: console messages arrive with source-mapped stack traces, network requests can be listed and opened one by one, and performance_start_trace / performance_analyze_insight produce the same insights you see in the Performance panel. Second, the default way an agent reads a page is take_snapshot, a text dump of the accessibility tree where every element has a uid the agent can pass to click, fill or hover; the docs tell agents to prefer a snapshot over a screenshot. Third, it is maintained by the Chrome DevTools team, which officially supports Google Chrome and Chrome for Testing only; other Chromium browsers may work but are not guaranteed.
How a session starts. Connecting the MCP client does not open a browser. The server launches Chrome the first time the agent calls a tool that needs one. By default it uses the stable channel and a persistent profile at $HOME/.cache/chrome-devtools-mcp/chrome-profile (Linux and macOS), which is reused between runs; --isolated swaps that for a temporary profile deleted when the browser closes.
Release cadence. The GitHub releases page shows v1.11.0, v1.12.0 and v1.13.0 within about four weeks, and the npm registry reported 2,405,354 downloads in the most recent week we checked. Because most configs use chrome-devtools-mcp@latest, your agent picks up new tools on its next start; pin a version in args if you need a stable tool list for CI.
Install it in Claude Code, Cursor, Codex, Gemini CLI and Copilot
Every client uses the same standard entry: command npx, args -y and chrome-devtools-mcp@latest. The project's client configuration guide lists 27 clients. The commands below are copied from that guide; the --scope user and -s user variants make the server available in every project instead of only the current one.
Plugin or plain MCP? The plugin route installs the server plus seven skills (chrome-devtools, chrome-devtools-cli, a11y-debugging, cookie-debugging, debug-optimize-lcp, memory-leak-debugging, troubleshooting) that teach the agent how to use the tools. The README warns that skills describe the tools of one version, so update them whenever you update the server. If you previously added the server by hand in Claude Code, the guide says to remove that entry before installing the plugin.
Requirements. A current Node.js LTS with npm, and Chrome stable or newer. On Windows 11 the guide's Codex example sets SystemRoot and PROGRAMFILES in env and raises startup_timeout_ms to 20,000 in .codex/config.toml, because the first npx download can be slow.
Check it works. The README's first prompt is: check the performance of https://developers.chrome.com. The client should open Chrome and record a performance trace. If nothing happens, run npx chrome-devtools-mcp@latest --help in a terminal to confirm Node can fetch and start the package, then see the project's troubleshooting guide.
{
  "mcpServers": {
    "chrome-devtools": {
      "command": "npx",
      "args": [
        "-y",
        "chrome-devtools-mcp@latest",
        "--isolated",
        "--no-usage-statistics"
      ]
    }
  }
}The full tool list by category (v1.13.0)
The auto-generated Tool Reference for v1.13.0 lists 63 tools in 13 categories. Seven categories are on by default. We read the package source for v1.13.0 to see which tools carry an extra condition: click_at needs --experimentalVision, and 13 of the 14 memory tools (everything except take_heapsnapshot) need --memoryDebugging. That leaves 33 tools on a default start.
The debugging tools do most of the work. lighthouse_audit returns Lighthouse scores and the DOM nodes behind failing audits for accessibility, SEO, best practices and agentic browsing (not performance; the docs point to the trace tools for that). set_logpoints adds DevTools-style logpoints that log an expression each time a line runs without pausing the page, resolved through source maps. get_css_styles returns the matched CSS rules for an element, ordered by cascade precedence, with overridden declarations marked. screencast_start and screencast_stop record the page to an .mp4.
Turning categories on and off. Each category has a boolean flag, for example --categoryNetworkMocks=true or --categoryEmulation=false. Fewer tools means a shorter tool list in the model's context, which is the reasoning behind --slim: it replaces everything with three tools (navigate, evaluate, screenshot) for basic browsing tasks.
Flags, security and privacy defaults
All flags go in the args array after the package name, or in a JSON config file (--config, or ~/.config/cd4a/config.json on macOS and Linux) using camelCase keys. Flags on the command line override the file. These are the ones that change behavior most, with wording taken from the configuration guide:
Attaching to your own Chrome. --browser-url=http://127.0.0.1:9222 connects to a Chrome you launched with --remote-debugging-port=9222 and a non-default --user-data-dir, which Chrome itself requires for the debugging port. The advanced-usage guide warns that any application on your machine can connect to that port and control the browser, so do not browse sensitive sites while it is open. --autoConnect is the gentler route on Chrome 144 and later: Chrome shows a permission dialog, and the server gets all open windows of the default profile.
Several agents at once. Most clients start one server per conversation. If you run several independent sessions, pass --isolated so they do not fight over the shared default profile, which only one browser can use at a time. When one server is shared across sessions, page-ID routing (on by default) adds a pageId to page-scoped tools so each session works in its own tab.
Everything in the browser is visible to the agent. The README's first disclaimer says the server exposes the browser's content to MCP clients and lets them inspect, debug and modify any data in the browser or DevTools. If the agent's profile is logged in to your email or a production admin panel, the model can read those pages too. The simplest guard is --isolated for routine QA, plus --allowed-url-pattern so the browser can only load your staging host.
Two kinds of data go to Google by default. Usage statistics (tool success rates, latency, environment information) are collected unless you pass --no-usage-statistics or set CHROME_DEVTOOLS_MCP_NO_USAGE_STATISTICS or CI in the environment. Separately, the performance tools may send trace URLs to the Chrome UX Report (CrUX) API to fetch field data; --no-performance-crux turns that off. Staging URLs you trace are worth keeping out of that lookup. The server also checks npm for updates periodically; CHROME_DEVTOOLS_MCP_NO_UPDATE_CHECKS disables it.
JavaScript evaluation is on. evaluate_script runs whatever function the model writes inside the page. --javascriptEvaluation=false disables that tool, set_logpoints and the initScript parameter, but the docs are explicit that this is not a sandbox: clicks and typing still run page scripts. File access is limited by default: when the client does not negotiate MCP roots, tools that read or write local files are confined to the OS temp directory unless you pass --allowUnrestrictedPaths.
Lock the config file. The configuration guide warns that a config file can set executablePath, chromeArg and the URL allow and block lists, so an agent that can write to the config location can loosen those restrictions. Keep the file and its directory read-only for the agent.
A worked QA session on a public page
This is the sequence of tool calls a QA prompt produces, using the tool names and parameters from the Tool Reference. The target is the README's own test page, https://developers.chrome.com, so you can repeat it without touching a site you own. The prompt: open the page on a mobile viewport, check the console for errors, list failed network requests, run a Lighthouse accessibility audit and record a performance trace, then report.
Step 1, open and emulate. The agent calls new_page with the URL, then emulate with a mobile viewport (or uses lighthouse_audit with device: "mobile" later). new_page returns a page ID that every later call passes as pageId.
Step 2, read the page. take_snapshot returns the accessibility tree as text with a uid per element. This is what the agent reasons over; it is much smaller than a screenshot and gives the agent stable handles for click and fill.
Step 3, console and network. list_console_messages (optionally with types to keep only errors and includeStackTraces: true) and list_network_requests show what broke. get_network_request opens a single request with headers and body, which is where CORS and 4xx problems become obvious.
Step 4, audits. lighthouse_audit with mode: "navigation" reloads and audits accessibility, SEO and best practices, saving the full report to disk. For speed, performance_start_trace with a reload, then performance_stop_trace and performance_analyze_insight on the insight it names, such as an LCP breakdown.
Step 5, prove the fix. After the agent edits code on your local build, it reloads with navigate_page, repeats the snapshot and the console check, and takes a take_screenshot with fullPage: true as evidence for the pull request. This verify step is the use case the Chrome team led with in its launch post: the agent can confirm in the browser that its change works.
Prompt (any MCP client with chrome-devtools connected):

  Open https://developers.chrome.com on a mobile viewport.
  1. List console errors with stack traces.
  2. List network requests that failed or returned 4xx/5xx.
  3. Run a Lighthouse audit (navigation mode, mobile) and list failing
     accessibility audits with the DOM nodes they flag.
  4. Record a performance trace with reload and explain the LCP insight.
Report findings as a table; do not change anything on the page.What developers say about it on X (our data)
We searched X with our own API for posts about the server, collected in 2026: the Latest stream for "chrome devtools mcp" OR "chrome-devtools-mcp" OR "devtools mcp" (with four 10-day date windows to reach further back), the Top results for the same query, and posts linking the package (url:chrome-devtools-mcp). After removing duplicates that gave 651 posts from 517 distinct accounts. 57.5% link the repository or npm package, so most of this is people sharing the tool, not just name-dropping it.
Claude leads by a wide margin. 24.4% of posts name Claude or Claude Code, more than Codex, Cursor and Copilot combined. 31.2% name at least one client and 9.8% name two or more, often in "works in Claude Code and Cursor" setup posts. Playwright, the other browser tool agents commonly use, comes up in 13.1% of posts.
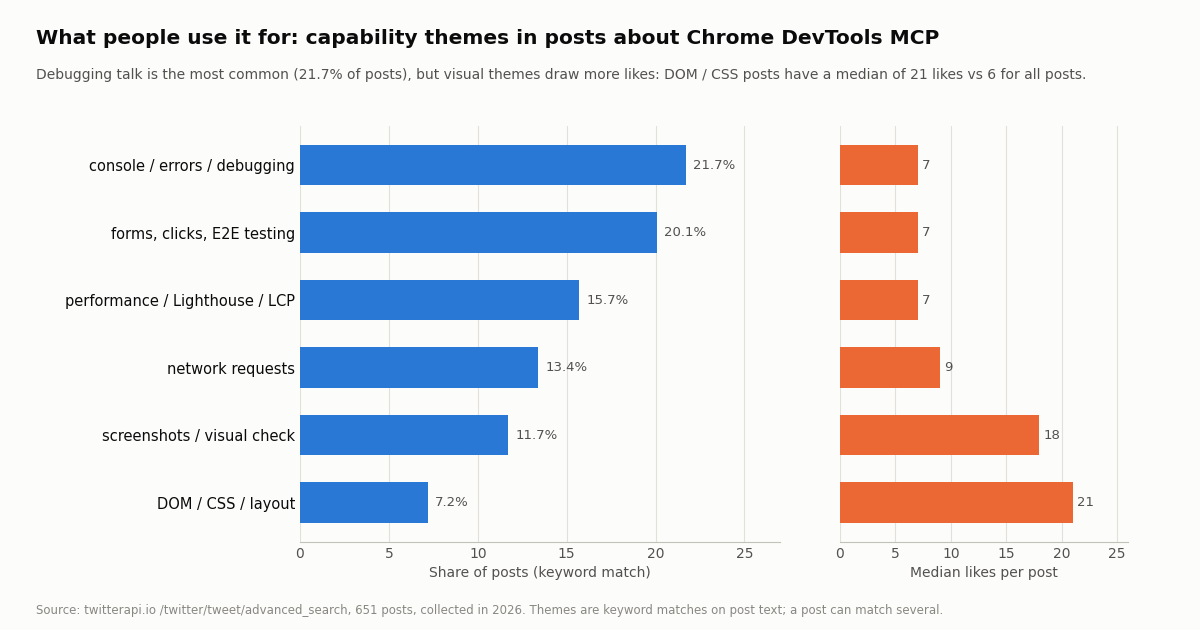
Debugging is the most common topic, visual work draws the most likes. Console and error talk appears in 21.7% of posts and forms, clicks and testing in 20.1%, but posts about DOM, CSS and layout have a median of 21 likes and screenshot posts 18, against 6 for the whole sample.
People save these posts more than they like them. Across the sample, bookmarks outnumber likes by 1.28 to 1 (85,211 bookmarks vs 66,572 likes), and 23.2% of posts have more bookmarks than likes. That pattern fits reference material: setup threads and prompt recipes people plan to come back to.
Attention is concentrated. The 10 most-liked posts hold 38.4% of all likes, and the official @ChromiumDev account (Chrome for Developers) is the most-liked author in the sample with 15 posts and 11.9% of all likes. English is 59.0% of posts, Japanese 16.0% and Chinese 13.2%.
Which capabilities people use, and how the weeks compare
Weekly volume. The Latest searches returned 142 posts in the most recent week, 62 the week before, and between 22 and 33 a week for the five weeks before that. The newest week includes the v1.13.0 release. Treat the slope with care: older date windows returned fewer posts, and part of that drop can be search coverage of older posts rather than falling interest.
Launch interest still dominates the Top results. Of the 158 posts X ranks as Top for the query, 42 (26.6%) were posted in the first four weeks after the September 23, 2025 public preview, and 58 (36.7%) in the last seven weeks of our window. The tool is past its launch moment and into steady everyday use.
Adding live X data to the same agent
Chrome DevTools MCP gives an agent a browser; it is not a data source. Agents that need posts from X (Twitter), for a social-proof widget you are testing, a dashboard that shows mentions, or research before a launch, should not scrape x.com through the browser: the logged-in session in your profile would be doing the reading. A data API returns structured JSON with no X account needed.
Two routes. Add our hosted MCP server next to Chrome DevTools MCP, so the agent has both: in Claude Code that is claude mcp add --transport http --scope user twitterapi-io https://mcp.twitterapi.io/mcp --header "Authorization: Bearer your_key_here", which exposes 12 tools for X data such as search_tweets, get_user_last_tweets and get_tweet_replies. Or call the REST API directly from code, as the script in this page does with /twitter/tweet/advanced_search.
What it costs, compared with X's own API. On TwitterAPI.io tweet endpoints cost $0.15 per 1,000 tweets returned; a call that finds nothing is billed the 15-credit minimum, $0.00015. X's official pay-per-usage rate card at docs.x.com/x-api/getting-started/pricing charges $0.005 per post read, which is $5 per 1,000 posts, about 33x more per 1,000 tweets. The study on this page used 64 requests and returned 970 tweets, roughly $0.15. New accounts that pass the automatic bot check get up to $1 of free credits (at most 100,000 credits, no card, one per person or network, expiring after 31 days); purchased credits never expire. Rate limits start at 0.2 requests per second before the first payment and rise to 20 once paid.
How we collected this
Question. What do developers on X do with Chrome DevTools MCP, and which coding agents do they pair it with?
Query and window. /twitter/tweet/advanced_search with "chrome devtools mcp" OR "chrome-devtools-mcp" OR "devtools mcp" (Latest, plus four 10-day windows reaching back about seven weeks, and Top) and url:chrome-devtools-mcp (Latest). Collected in 2026. 64 requests, 970 tweets returned, 651 distinct posts from 517 accounts. We planned about 1,000 posts; this is everything the searches returned.
Method. Client and theme shares are case-insensitive keyword matches on post text (the regular expressions are in the study script), so a post can count under several labels and a post that says only "Claude" counts toward Claude / Claude Code. Weekly volume uses the Latest results only.
What the sample cannot show. Search returns fewer posts for older windows, so the weekly trend mixes real interest with coverage. Mentions are not usage: most users never post about their tools, and posts in Japanese or Chinese can name a client in a form our patterns miss. Likes and bookmarks measure attention, not quality.
Privacy. Aggregates only. Raw search pages were not kept in the repository because most authors are private individuals; the published sample has no IDs, URLs, text or handles. The only account named is the official @ChromiumDev organization account.
"""devtools_mcp_chatter.py - tally which coding agents people pair with Chrome DevTools MCP on X.

    pip install requests
    export TWITTERAPI_IO_API_KEY=...   # from the twitterapi.io dashboard
    python devtools_mcp_chatter.py
"""
import os
import re
from collections import Counter

import requests

BASE = "https://api.twitterapi.io"
HEADERS = {"X-API-Key": os.environ["TWITTERAPI_IO_API_KEY"]}
QUERY = '"chrome devtools mcp" OR "chrome-devtools-mcp" OR "devtools mcp"'
CLIENTS = {
    "Claude / Claude Code": r"claude[ -]?code|\bclaude\b",
    "Cursor": r"\bcursor\b",
    "Codex": r"\bcodex\b",
    "Gemini": r"\bgemini\b",
    "Copilot / VS Code": r"copilot|vs ?code|vscode",
    "Playwright (other tool)": r"playwright",
}


def search(query, max_pages=10):
    """Yield tweets from advanced_search, newest first, following next_cursor."""
    cursor = ""
    for _ in range(max_pages):
        r = requests.get(
            f"{BASE}/twitter/tweet/advanced_search",
            headers=HEADERS,
            params={"query": query, "queryType": "Latest", "cursor": cursor},
            timeout=30,
        )
        r.raise_for_status()
        data = r.json()
        for t in data.get("tweets", []):
            yield t
        if not data.get("has_next_page"):
            break
        cursor = data.get("next_cursor", "")


def main():
    seen, tally, likes = set(), Counter(), []
    for t in search(QUERY):
        if t["id"] in seen:
            continue
        seen.add(t["id"])
        text = (t.get("text") or "").lower()
        likes.append(t.get("likeCount", 0))
        for name, rx in CLIENTS.items():
            if re.search(rx, text):
                tally[name] += 1
    n = len(seen)
    print(f"{n} posts, estimated cost ${n * 0.00015:.4f} at $0.15 per 1,000 tweets returned")
    for name, k in tally.most_common():
        print(f"{name:26s} {k:4d}  {100 * k / max(n, 1):5.1f}%")
    if likes:
        likes.sort()
        print("median likes:", likes[len(likes) // 2])


if __name__ == "__main__":
    main()
Researching this?Free starter credits cover end-to-end testing — Google sign-in, no card. Get a key.
Questions readers ask
What is the Chrome DevTools MCP server?
It is Google's open-source MCP server, published on npm as chrome-devtools-mcp, that lets an AI coding agent control and inspect a live Chrome browser through DevTools: navigate, click and fill, read console messages and network requests, take accessibility-tree snapshots and screenshots, record performance traces and run Lighthouse audits. The Chrome team announced its public preview on September 23, 2025.
How do I add Chrome DevTools MCP to Claude Code?
Run claude mcp add chrome-devtools --scope user npx chrome-devtools-mcp@latest. To get the bundled skills too, install it as a plugin: /plugin marketplace add ChromeDevTools/chrome-devtools-mcp, then /plugin install chrome-devtools-mcp@chrome-devtools-plugins, and restart Claude Code. Remove any earlier manual entry first.
How many tools does Chrome DevTools MCP have?
The v1.13.0 Tool Reference lists 63 tools in 13 categories. Six categories (network mocks, extensions, third-party, WebMCP, PWA, WebAuthn) are off by default, click_at needs --experimentalVision and 13 heap-analysis tools need --memoryDebugging, so a default start exposes 33. --slim reduces it to 3 tools.
Can Chrome DevTools MCP use my existing Chrome with my logins?
Yes, two ways. --autoConnect attaches to a running Chrome 144 or later after you enable remote debugging at chrome://inspect/#remote-debugging and approve the dialog; the server then sees all windows of the default profile. Or start Chrome with --remote-debugging-port=9222 and a non-default user data directory and pass --browser-url=http://127.0.0.1:9222. Either way the agent can read everything in those windows, so avoid sensitive sites.
Does Chrome DevTools MCP send data to Google?
By default it collects usage statistics (tool success rates, latency, environment information); opt out with --no-usage-statistics or by setting CHROME_DEVTOOLS_MCP_NO_USAGE_STATISTICS or CI. Performance tools may also send trace URLs to the CrUX API for field data; disable with --no-performance-crux.
Does it run headless or in CI?
Yes. Pass --headless (and usually --isolated for a throwaway profile). Usage statistics are also off automatically when the CI environment variable is set. Pin a version instead of @latest in CI if you need the tool list to stay the same.
Is Chrome DevTools MCP the same as Browser Use MCP or Playwright MCP?
No. Chrome DevTools MCP is maintained by Google's Chrome DevTools team and focuses on DevTools features such as traces, console and network inspection, and Lighthouse. Browser Use's MCP server is built around the Browser Use agent library, and Playwright MCP is a separate server built on the Playwright testing library. In our sample of X posts, 13.1% of posts about Chrome DevTools MCP also mention Playwright.
Can Chrome DevTools MCP read tweets from X?
It can open x.com in the browser like any page, but then the browsing is done by whatever account is logged in to that profile. For structured X data, add a data MCP server or call a REST API: on TwitterAPI.io tweet endpoints cost $0.15 per 1,000 tweets returned and no X account is needed.
Continue
- ChromeDevTools/chrome-devtools-mcp on GitHub: README, disclaimers, usage statistics, skills and plugin install
- Chrome DevTools MCP Tool Reference (v1.13.0, 63 tools in 13 categories)
- Chrome DevTools MCP configuration guide (all flags and the config file)
- Chrome DevTools MCP client configuration guide (Claude Code, Codex, Cursor, Gemini CLI, Copilot)
- chrome-devtools-mcp on npm (version, license, Node engines)
- Chrome for Developers: Chrome DevTools MCP public preview announcement
- X (Twitter) API guides and endpoints hub
- What an MCP server is and how clients talk to it
- Browser Use MCP setup, a different browser-agent server
- Claude in Chrome, Anthropic's browser extension
- MCP vs CLI tools for coding agents
- Adding MCP servers to OpenAI Codex
- How to build your own MCP server
- Hosted Twitter (X) MCP server for live X data
- TwitterAPI.io pricing per 1,000 tweets
- 01Can People See Your Twitter (X) Bookmarks? What Others See, and the One Public Number
- 02ChatGPT vs Grok: plans, models, and the real difference on Twitter (X) data
- 03IFTTT Alternatives in 2026: Which Can Still Trigger on a New Twitter (X) Post
- 04Buffer Alternatives in 2026: Which Schedulers Still Post to Twitter (X), and the DIY Route
- 05Claude Token Counter: Count Tokens Exactly With the count_tokens API (and Budget Twitter (X) Data)
- 06How to Build an MCP Server in Python for Twitter (X) Data
- 07MCP Server Workflow Automation: the 14 Best MCP Servers for Claude Code, Codex and Cursor, Twitter (X) Data Included
- 08What Is an MCP Server? How AI Clients Talk to It, With a Live Twitter (X) Example
Writing about something you built with TwitterAPI.io? Our community rewards program pays API credits for honest tutorials, build logs and videos.
Stop reading. Start building.
Starter credits cover real testing on real data. Google sign-in, no card, no application queue.
Get an API keyAlready building with TwitterAPI.io? Publish an honest tutorial or build log about it and earn up to $200 a month in API credits.