What Percentage of Twitter (X) Is Bots? Every Published Estimate and Its Method
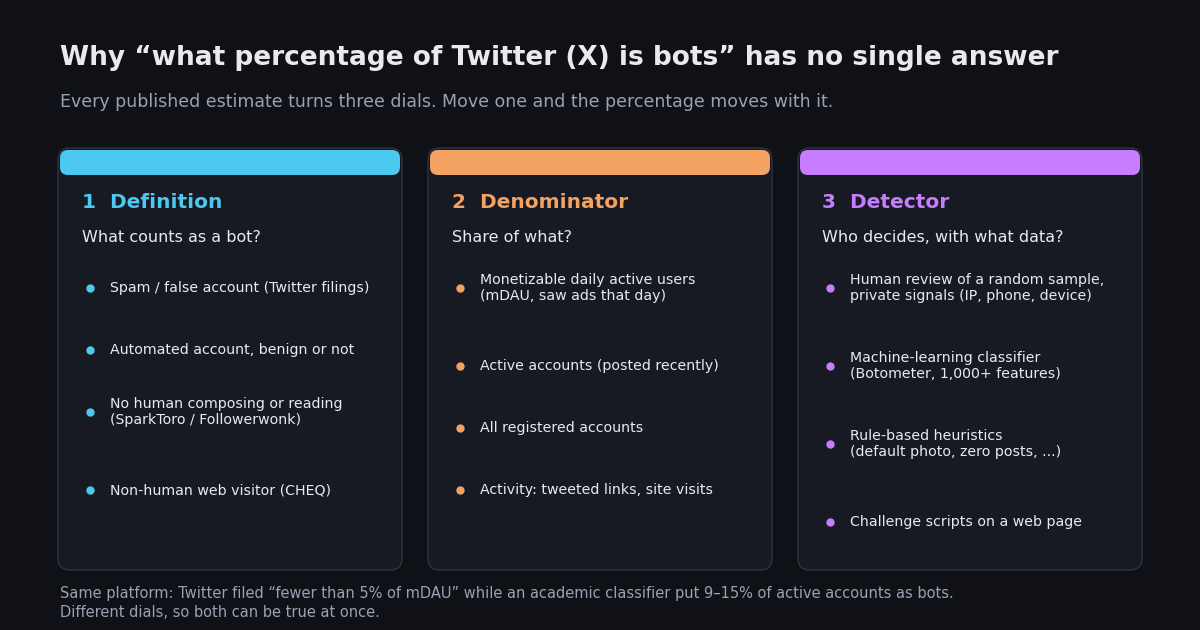
"What percentage of Twitter is bots" sounds like a question with a number for an answer. It is not, and the reason is worth understanding before you quote any figure: the estimates that circulate, from under 5% to over 70%, are all real, all sourced, and all measuring different things. This page is the statistics reference. It collects every published estimate with its year, its method, and the exact population it describes, and then explains why they disagree. If what you want is to understand what a bot is, how the benign ones differ from spam, and how to tell whether one account is automated, that is the job of the Twitter (X) bots explainer; this page assumes you know what a bot is and want the numbers.
The estimates fall into three families. Twitter's own figure, filed with the SEC for eight years, counts spam as a share of monetizable daily active users. Independent account-level studies count bots or fakes as a share of active or total accounts. Activity studies count what bots do rather than how many there are: the share of links or visits that come from automated accounts. Comparing a number from one family with one from another is how most of the confusion around the 2022 Musk acquisition dispute started, so the table below labels each row by family.
The final section turns the question around. The platform-wide share is not actionable; the bot share of your own followers, or of an account you are about to pay to advertise with, is. A short Python script samples followers through the API, applies flags you can read and change, and prints a share with the caveat that no heuristic is ground truth. The same approach, with a fuller scorecard, is the basis of the Twitter (X) account audit guide.
Every published estimate of the Twitter (X) bot share, side by side
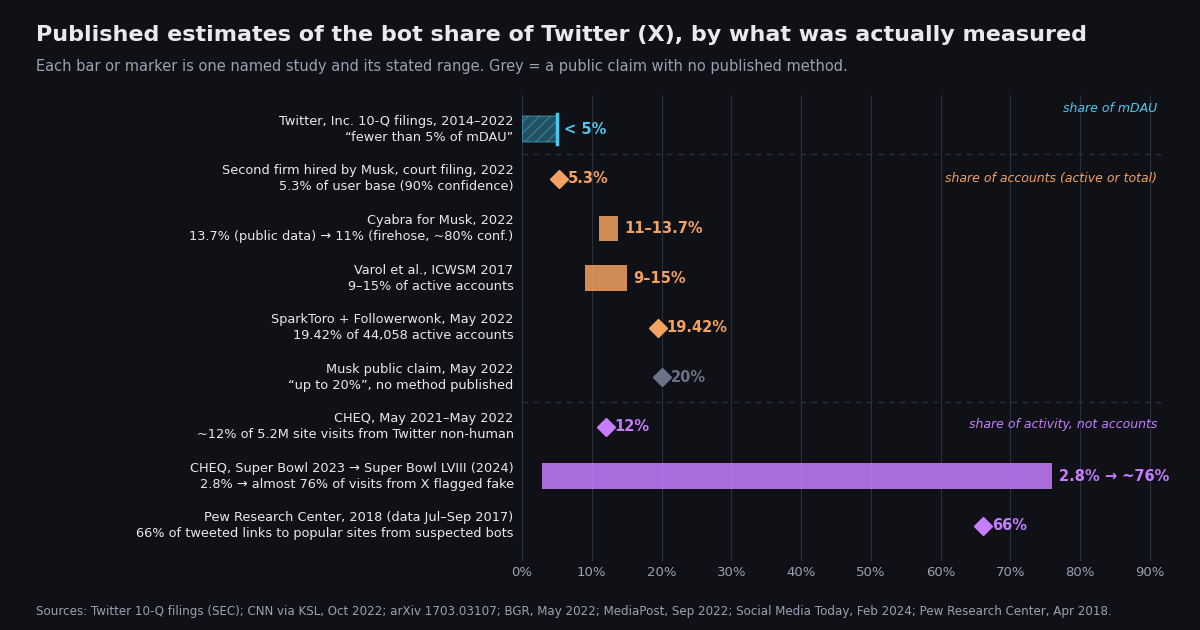
The table lists each estimate that is regularly quoted, who produced it and when, what population the percentage describes, and how it was measured. The "share of what" column is the one to read first: it is the main reason the numbers differ. Each figure is a historical measurement tied to its year; none of them describes X today, and X has not published a new percentage since it went private (see the section on what X has said since).
The chart below plots the same rows, grouped by family. The grey marker is the one entry with no published method; it is on the chart because it drove the 2022 news cycle, not because it is a measurement.
Twitter's own figure: "fewer than 5% of mDAU", and how it was produced
The number most people have heard is Twitter's. In its Form 10-Q for the first quarter of 2022, the last full quarter before the acquisition dispute, Twitter reported that an internal review of a sample of accounts estimated that false or spam accounts averaged fewer than 5% of its mDAU during the quarter, and added the standard caveat: "In making this determination, we applied significant judgment, so our estimation of false or spam accounts may not accurately represent the actual number of such accounts, and the actual number of false or spam accounts could be higher than we have estimated" (Twitter, Inc. 10-Q for the quarter ended March 31, 2022, SEC EDGAR). The same language appears in the filings back to 2014 and in the final 10-Q for the quarter ended June 30, 2022, which reported 237.8 million average mDAU (SEC EDGAR).
Three details of this figure matter for comparison. First, the denominator is mDAU: accounts that logged in on a given day and could be shown ads. Dormant spam accounts that never log in are not in the denominator at all, so the 5% says nothing about the share of all registered accounts. The how many Twitter (X) users are there page explains how mDAU differs from the user counts X reports today.
Second, the method was human review of a random sample, not an algorithm. In a July 2022 briefing with reporters, Twitter executives said human reviewers manually examined thousands of randomly selected accounts each quarter, combining public information such as account activity with private data such as IP address, phone number and device signals that cannot be disclosed, and that the company removed more than 1 million spam accounts a day (Reuters, as reported by Gigazine, July 2022). Then-CEO Parag Agrawal had made the same point publicly in May 2022: the estimate, in his words, could not be performed externally because it needs both public and private information.
Third, Twitter never claimed precision, and its definition is spam or false accounts, which is narrower than "automated": a weather bot or a newsroom's auto-poster would not count toward the 5% at all. When Elon Musk's July 2022 termination letter called the true share "wildly higher than the Twitter estimate" (CNN via KSL, October 2022), the two sides were, in part, arguing about definitions.
The 2022 acquisition dispute: 20%, 19.42%, 11% and 5.3%
The bot percentage became front-page news in May 2022, when Musk announced that his $44 billion purchase of Twitter was on hold pending proof that spam and fake accounts were under 5% of users, and said publicly that the real share could be as high as 20% (MediaPost, September 2022). No method was ever published for the 20%, which is why the chart marks it in grey.
SparkToro and Followerwonk, 19.42%. Within days, the two analytics companies ran the first large public sample: 44,058 public accounts active in the previous 90 days, drawn at random from more than 130 million active profiles between May 13 and 15, 2022. Under a definition they called conservative, accounts "that do not regularly have a human being personally composing the content of their tweets, consuming the activity on their timeline, or engaging in the Twitter ecosystem", 19.42% met it, nearly four times Twitter's figure, and the authors said the count likely undercounted (BGR, May 18, 2022). The population is active public accounts, not mDAU, and the definition catches unattended but harmless automation, so it is a different measurement rather than a refutation of the 10-Q number.
Cyabra, 13.7% then 11%. Cyabra, an Israeli analytics company, first estimated 13.7% from public data. Musk's team then commissioned a second analysis using the firehose data Twitter had provided under the merger agreement; that analysis, cited in court filings, concluded with roughly 80% confidence that spam and bot accounts were 11% of Twitter's total user base (CNN via KSL, October 11, 2022). CNN's report made the key caveat explicit: 11% of total users is not comparable with 5% of mDAU, because the bases differ.
A second firm, 5.3%. The same filings disclosed that another firm Musk had hired estimated, with 90% confidence, that bots were 5.3% of the user base. Twitter's lawyers argued that neither this nor Cyabra's number supported the "wildly higher" claim in the termination letter (CNN via KSL, October 2022). The dispute ended when the acquisition closed in October 2022, before a court ruled on the bot question, so none of the numbers was ever tested at trial. What the episode left behind is the clearest demonstration in the public record that two competent teams, given the same firehose, produced 5.3% and 11% depending on their classifier and definition.
Academic estimates: Varol et al.'s 9-15%, Botometer, and the false-positive problem
The most cited academic figure comes from Onur Varol, Emilio Ferrara, Clayton Davis, Filippo Menczer and Alessandro Flammini, whose paper "Online Human-Bot Interactions: Detection, Estimation, and Characterization" was presented at ICWSM 2017. They built a supervised classifier on more than 1,000 features drawn from public data and metadata about each account (friends, tweet content and sentiment, network patterns, activity time series), trained on manually annotated bot and human accounts, and wrote: "Our estimates suggest that between 9% and 15% of active Twitter accounts are bots" (arXiv 1703.03107, submitted March 2017). The population is active accounts in the English-language sample the authors could reach through the public API of the time; the range reflects different score thresholds.
That classifier lineage became Botometer, the public tool from Indiana University's Observatory on Social Media (OSoMe) that returned a 0-to-1 score for any handle. Botometer's score is a probability-like output from a random-forest model, and the choice of threshold decides the headline number: a lower threshold counts more accounts as bots. The original tool went offline after X ended free research access to its API in 2023; its successor, Botometer X, serves pre-computed scores from data collected before June 2023, has no record of accounts created after May 31, 2023, and its authors state it cannot detect bots driven by newer AI models (OSoMe blog, February 2024). In other words, the academic pipeline that produced the 9-15% cannot be re-run on X in 2026.
The classifier approach also has a measured error rate. Adrian Rauchfleisch and Jonas Kaiser collected 374,724 Botometer scores for 4,134 accounts of known status (verified bots and verified humans, in English and German) over three months in 2019. At the commonly used 0.76 threshold, under an assumed 15% bot prevalence, roughly 41% of the accounts Botometer flagged as bots were in fact human across the combined data, rising to about 76% false positives on German-language politicians, while recall was only 10-20%, meaning most real bots were missed (PLOS ONE, October 2020). Their recommendation, that population-level estimates need manual validation of a sample rather than a bare threshold, is the single most useful thing to remember when you read any bot percentage produced by a model.
Activity is not accounts: Pew's 66% of links and CHEQ's traffic numbers
The highest figures in circulation measure what bots do, not how many there are, and they should never be read as "X% of Twitter is bots".
Pew Research Center, 66% of tweeted links. Pew examined about 1.2 million tweets containing links to popular websites, posted between July and September 2017 by 140,545 accounts, and scored each account with Botometer at a threshold of 0.43. Roughly 66% of the links were posted by accounts above the threshold, that is, by suspected bots (Pew Research Center, April 19, 2018). Pew chose the threshold explicitly for an "average estimate of the big-picture role bots are playing" rather than for judging individual accounts, acknowledged false positives and negatives, and checked that excluding verified institutional accounts changed the result very little. The finding is that automated accounts generate a disproportionate share of link-sharing, which is compatible with a much smaller share of accounts being bots.
CHEQ, 12% of visits in 2021-2022. CHEQ, an ad-fraud vendor, measures something different again: clicks that arrive on its clients' websites from Twitter. Across 5.2 million visits to roughly 15,000 client sites between May 2021 and May 2022, about 12% were classified as non-human after the visitor was run through more than 2,000 challenges, with far higher shares from some regions, for example 29% of organic Twitter traffic from China (MediaPost, September 19, 2022). This counts visitors, so one automated account clicking a thousand ads counts a thousand times.
CHEQ, almost 76% during Super Bowl LVIII. The same methodology produced the most quoted recent number: of 144,000 visits from X to CHEQ client sites over the Super Bowl weekend in February 2024, almost 76% were classified as fake, against 2.8% of 159,000 visits from X over the Super Bowl weekend a year earlier (Social Media Today, February 16, 2024). It is a striking measurement of ad-click quality during one event; it says nothing about the share of X accounts that are bots, and the swing from 2.8% to 76% between two editions of the same event shows how event-dependent activity measures are.
Why the estimates diverge: definition, denominator, detector, and time
Put the table and the studies together and four variables explain nearly all of the spread.
Definition. Twitter counted "false or spam" accounts, which excludes benign automation. Varol et al. and Botometer count automated accounts of any intent. SparkToro and Followerwonk counted accounts with no human regularly composing or reading, which includes abandoned accounts and unattended feeds. CHEQ counts non-human web visitors, many of which are scrapers and click bots rather than Twitter accounts at all. The same account can be a bot under one definition and not under another; a verified news outlet's auto-posting feed is automated, not spam, and has a human reading the replies.
Denominator. mDAU excludes accounts that did not log in that day, which removes most dormant spam from both numerator and denominator. "Active accounts" depends on the activity window (SparkToro used 90 days). "Total user base" includes every registered account that was ever created and not deleted. Activity measures use a denominator of links or visits. CNN's note that Cyabra's 11% of total users cannot be compared with Twitter's 5% of mDAU applies to every pair of rows in the table that sit in different families.
Detector and data. Twitter's reviewers had IP addresses, phone numbers and device signals; every outside study had only what the public API exposed, and since 2023 less than that. Classifiers carry the error rates Rauchfleisch and Kaiser measured, and the threshold moves the headline. Heuristics are transparent but blunt. Challenge scripts identify non-human browsers, not accounts.
Time. Twitter said in July 2022 that it removed more than 1 million spam accounts a day (Reuters via Gigazine), and X's transparency report for January to June 2024 records about 5.3 million account suspensions, with platform manipulation and spam the most common reason (The Drum; Gigazine, September 2024). A bot share is a snapshot of a population that is being created and culled continuously, so a 2017 estimate, a May 2022 estimate and a 2024 estimate describe three different platforms. This is also why the page keeps every number attached to its year.
The practical consequence: a bot percentage quoted without its definition, denominator and method is a headline, not a measurement. When you need a number for a decision, measure the population you care about, which is the subject of the last section.
What X has said since the acquisition: suspensions, purges, and no new percentage
Since Twitter went private in October 2022 there have been no quarterly filings, and X has not published a replacement for the mDAU-based spam estimate. What it has published is enforcement volume. Its first Global Transparency Report under the new ownership, covering January to June 2024, reported roughly 5.3 million accounts suspended for violating its rules, compared with about 1.6 million in the first half of 2022, and more than 224 million user reports, with platform manipulation and spam the leading reason for suspension (The Drum, September 26, 2024; Gigazine, September 2024).
Purges have continued to be announced as events rather than rates. In April 2026, X's head of product Nikita Bier said the platform was identifying and suspending 208 bot accounts per minute, following an earlier initiative that removed 1.7 million bots in a single October (Social Media Today, April 9, 2026). Suspension counts show effort, not prevalence: 208 removals a minute is consistent with a large bot population, a high creation rate, or both, and does not convert into a percentage without a denominator X has not disclosed.
For the reader who needs a defensible current figure, the honest answer is that none exists in the public record for X as a whole. The last filed number is Twitter's "fewer than 5% of mDAU" for the quarter ended June 30, 2022, the last independent account-level samples are from 2022, and the tools behind the academic estimates no longer have the data access to repeat them.
Measure the bot share of your own audience with the API
The platform-wide share matters less than the share in the population you act on: your followers, the followers of an account you plan to sponsor, or the accounts engaging with a campaign. That population is measurable, because follower lists are public and the follower objects carry the signals the heuristic studies above used. The script below pages twitterapi.io's GET /twitter/user/followers endpoint, which returns full profile objects (userName, followers_count, following_count, statuses_count, created_at, profile_image_url_https) up to 200 per page with cursor paging (docs.twitterapi.io, Get User Followers, 2026), and applies four transparent flags:
Default profile image (the profile_image_url_https URL still points at X's default avatar). Zero posts (statuses_count of 0). Very recent creation (created_at within the last 90 days; the window is a parameter). Follow skew (following at least 200 accounts and more than ten times as many as follow back). X's own Automated label (isAutomated), the one signal that is a disclosure rather than a guess, is not part of follower objects; it comes from GET /twitter/user/info per account, so the script leaves it out. An account with two or more flags is reported as bot-like, and the script prints the share along with each flag's count so you can see what drove it.
The caveat is the one Rauchfleisch and Kaiser gave for Botometer: these flags are not ground truth. A new human account with no posts and a default photo trips two flags; a long-running spam account with a stolen photo and padded post count trips none. Calibrate on an account whose followers you know, read a sample of flagged profiles by hand, and report the result as "share of followers matching the flags", never as "share that are bots". For a fuller scorecard with engagement rate and posting cadence, the Twitter (X) audit guide extends this script.
Cost. Follower pages are priced per user returned, 1 to 3 credits each depending on page size, with 200 per page at the lowest tier (twitterapi.io/pricing and the endpoint page, 2026). A 2,000-follower sample therefore costs about 2,000-6,000 credits, which at $1 per 100,000 credits is $0.02 to $0.06. The official X API prices follower and following reads at $0.010 per user on its pay-per-use tier (docs.x.com/x-api/getting-started/pricing, 2026), so the same 2,000-follower sample is $20 there. New twitterapi.io accounts that pass the automatic bot check receive $1 of free credits (100,000 credits, no card, one per person or network, expiring after 31 days), which covers this sample many times over; details on the pricing page.
Rate. One request returns 200 followers, so a 2,000-follower sample is ten calls; the rate limit before a first payment is 0.2 requests per second, which the script's pacing respects. Everything here is read-only: "measure" means reading public data, not acting on accounts.
import os

import requests

BASE = "https://api.twitterapi.io"
HEADERS = {"X-API-Key": os.environ["TWITTERAPI_IO_KEY"]}  # key from twitterapi.io/dashboard


def followers_page(handle, cursor=""):
    """One page of up to 200 follower profiles (1 credit per follower at this page size)."""
    r = requests.get(
        f"{BASE}/twitter/user/followers",
        params={"userName": handle, "cursor": cursor, "pageSize": 200},
        headers=HEADERS,
        timeout=60,
    )
    r.raise_for_status()
    body = r.json()
    return body.get("followers") or [], body.get("next_cursor") or ""


if __name__ == "__main__":
    users, cursor = followers_page("twitterapi_io")
    print(f"{len(users)} followers on the first page; next cursor: {cursor[:12]}...")
"""Bot-like share of one Twitter (X) account's followers, via the twitterapi.io API.

Usage: python bot_share.py <handle> [sample_size]
Needs TWITTERAPI_IO_KEY in the environment (twitterapi.io/dashboard).
Cost: GET /twitter/user/followers is priced per follower returned, 1 to 3 credits
depending on page size (200 per page = lowest tier); 2,000 followers is roughly
2,000-6,000 credits, i.e. $0.02-$0.06 at $1 per 100,000 credits (twitterapi.io/pricing).

The flags below are heuristics, not ground truth. Calibrate on an account whose
followers you know, and read a sample of flagged profiles by hand before quoting a share.
"""
import os
import sys
import time
from datetime import datetime, timedelta, timezone

import requests

BASE = "https://api.twitterapi.io"
HEADERS = {"X-API-Key": os.environ["TWITTERAPI_IO_KEY"]}
X_DATE = "%a %b %d %H:%M:%S %z %Y"
NOW = datetime.now(timezone.utc)

# Tunable thresholds: every one of these is a judgment call, so keep them visible.
NEW_ACCOUNT_DAYS = 90        # created within this many days -> "new"
SKEW_MIN_FOLLOWING = 200     # follow-skew only applies above this many followings
SKEW_RATIO = 10              # following > SKEW_RATIO * followers -> "skew"
FLAGS_TO_CALL_BOTLIKE = 2    # an account with at least this many flags is "bot-like"


def get(url, params):
    r = requests.get(url, params=params, headers=HEADERS, timeout=60)
    r.raise_for_status()
    return r.json()


def parse_date(s):
    try:
        return datetime.strptime(s, X_DATE) if s else None
    except ValueError:
        return None


def sample_followers(handle, n):
    """Newest-first follower profiles, 200 per page, until n are collected."""
    out, cursor = [], ""
    while len(out) < n:
        body = get(f"{BASE}/twitter/user/followers",
                   {"userName": handle, "cursor": cursor, "pageSize": 200})
        page = body.get("followers") or []
        if not page:
            break
        out.extend(page)
        if not body.get("has_next_page") or not body.get("next_cursor"):
            break
        cursor = body["next_cursor"]
        time.sleep(5)  # 0.2 requests/s before a first payment; 20/s once paid
    return out[:n]


def flags_for(u):
    """Return the list of flag names an account trips. Transparent by design."""
    f = []
    pic = (u.get("profile_image_url_https") or "").lower()
    if not pic or "default_profile" in pic:
        f.append("default_image")
    if (u.get("statuses_count") or 0) == 0:
        f.append("zero_posts")
    created = parse_date(u.get("created_at"))
    if created and NOW - created < timedelta(days=NEW_ACCOUNT_DAYS):
        f.append("new_account")
    following = u.get("following_count") or 0
    followers = u.get("followers_count") or 0
    if following >= SKEW_MIN_FOLLOWING and following > SKEW_RATIO * max(followers, 1):
        f.append("follow_skew")
    return f


if __name__ == "__main__":
    handle = sys.argv[1] if len(sys.argv) > 1 else "twitterapi_io"
    size = int(sys.argv[2]) if len(sys.argv) > 2 else 2000
    users = sample_followers(handle, size)
    if not users:
        raise SystemExit(f"no followers returned for @{handle}")

    counts = {"default_image": 0, "zero_posts": 0, "new_account": 0, "follow_skew": 0}
    botlike = 0
    for u in users:
        f = flags_for(u)
        for name in f:
            counts[name] += 1
        if len(f) >= FLAGS_TO_CALL_BOTLIKE:
            botlike += 1

    n = len(users)
    print(f"@{handle}: sampled {n:,} most recent followers")
    for name, c in counts.items():
        print(f"  {name:<14} {c:>6,}  ({100 * c / n:5.1f}%)")
    print(f"\n  bot-like (>= {FLAGS_TO_CALL_BOTLIKE} flags): {botlike:,} of {n:,} = {100 * botlike / n:.1f}%")
    print("  Heuristic share, not ground truth: read a sample of flagged profiles before quoting it.")
Questions readers ask
What percentage of Twitter (X) is bots?
No single figure exists. Twitter's own filings said fewer than 5% of monetizable daily active users were false or spam accounts (10-Q filings, 2014 to Q2 2022). Independent account-level estimates range from 5.3% to 19.42%: 9-15% of active accounts (Varol et al., ICWSM 2017), 11% of total users (Cyabra, 2022), 19.42% of active accounts (SparkToro and Followerwonk, 2022). Activity-based figures such as Pew's 66% of tweeted links (2018) measure what bots do, not how many there are.
Did Twitter say 5% of its users were bots?
Not quite. Twitter's quarterly 10-Q filings said false or spam accounts were "fewer than 5%" of average mDAU, the users who logged in and could be shown ads that day, based on a human review of a random sample, and added that the actual number "could be higher". It was an upper bound on spam among daily active users, not a count of automated accounts across the platform, and no absolute bot count has ever been published.
Was Elon Musk right that 20% of Twitter was bots?
The 20% was a public claim with no published method. The two firms his own team hired in 2022 found 11% (Cyabra, about 80% confidence, of total users) and 5.3% (a second firm, 90% confidence), and Twitter's lawyers argued neither supported the "wildly higher" wording of his termination letter (CNN via KSL, October 2022). The closest independent figure was SparkToro and Followerwonk's 19.42%, under a broad definition that included unattended but harmless accounts.
What is Botometer, and can I still use it to check an account?
Botometer is the Indiana University (OSoMe) classifier that scored a Twitter account from 0 to 1 on more than 1,000 features; it descends from the model behind the 9-15% estimate. The original tool went offline when X ended free research API access in 2023. Botometer X, its successor, returns pre-computed scores from data collected before June 2023 and has nothing on accounts created after May 31, 2023 (OSoMe blog, February 2024). Its scores also carry measured false-positive rates (PLOS ONE, 2020), so treat them as a signal.
How can I check what percentage of my followers are bots?
Sample your follower list and apply transparent flags: default profile image, zero posts, account created in the last 90 days, and a heavy following-to-followers skew. The script on this page does that through twitterapi.io's followers endpoint; a 2,000-follower sample costs about $0.02 to $0.06. Report the result as the share matching the flags, read some flagged profiles by hand, and do not call it a bot count.
Why do estimates of Twitter bots vary from 5% to 76%?
Four reasons: definition (spam vs any automation vs no human present vs non-human web visitor), denominator (mDAU vs active accounts vs all accounts vs links or visits), detector (human review with private signals vs a classifier with error rates vs rules), and time (accounts are created and suspended continuously). The 76% figure, for example, is CHEQ's share of ad clicks from X during one Super Bowl weekend in 2024, not a share of accounts.
Has X published a new bot percentage since 2022?
No. The last filed figure is Twitter's "fewer than 5% of mDAU" for the quarter ended June 30, 2022. Since then X has published enforcement counts (5.3 million suspensions in the first half of 2024; 208 bot suspensions a minute cited in April 2026) but no prevalence estimate with a denominator, so no current platform-wide percentage can be sourced.
Continue
- Twitter, Inc. Form 10-Q for the quarter ended March 31, 2022 (SEC EDGAR): false or spam accounts fewer than 5% of mDAU, internal sample review, "could be higher"
- CNN via KSL, October 2022: Cyabra's 11% (about 80% confidence) and 13.7%, a second firm's 5.3% (90% confidence), and Twitter's response in court filings
- Varol, Ferrara, Davis, Menczer, Flammini: Online Human-Bot Interactions (ICWSM 2017), 9% to 15% of active accounts
- BGR, May 2022: SparkToro and Followerwonk analysis of 44,058 active accounts, 19.42% fake or spam
- Pew Research Center, April 2018: 66% of tweeted links to popular sites from suspected bots, Botometer threshold 0.43
- Rauchfleisch and Kaiser, PLOS ONE 2020: the false-positive problem of automatic bot detection (Botometer)
- Twitter (X) API overview: the hub for reading X data
- What Twitter (X) bots are, the kinds you meet, and how to spot one
- How to audit a Twitter (X) account for fake followers and engagement health
- How many Twitter (X) users there are, and what mDAU, MAU and supported accounts mean
- Tracking Twitter (X) follower growth over time with the API
- twitterapi.io pay-per-call pricing: followers, profiles, and tweets
- Get an API key and free credits on the twitterapi.io dashboard
- 01How Do You Turn On Twitter (X) Dark Mode, and What Are Its Exact Colors?
- 02How Do You Create a Second Twitter (X) Account, and What Does X Allow?
- 03What Was Twitter (X) Circle, and What Can You Use Instead?
- 04Can You Hide Who You Follow on Twitter (X)?
- 05Deactivating a Twitter (X) Account: What Happens, Step by Step
- 06What Are Twitter (X) Bots and How Do They Work in 2026?
- 07Rate Limit Exceeded on Twitter (X) API — Causes & Fixes
- 08Count Tweets — Twitter (X) API Programmatic Guide
Stop reading. Start building.
Starter credits cover real testing on real data. Google sign-in, no card, no application queue.
Get an API key